How to Build Personalized User Dashboards in an Afternoon
Use GraphJSON's dynamic iframe API to embed personalized, per-user analytics dashboards in your product.
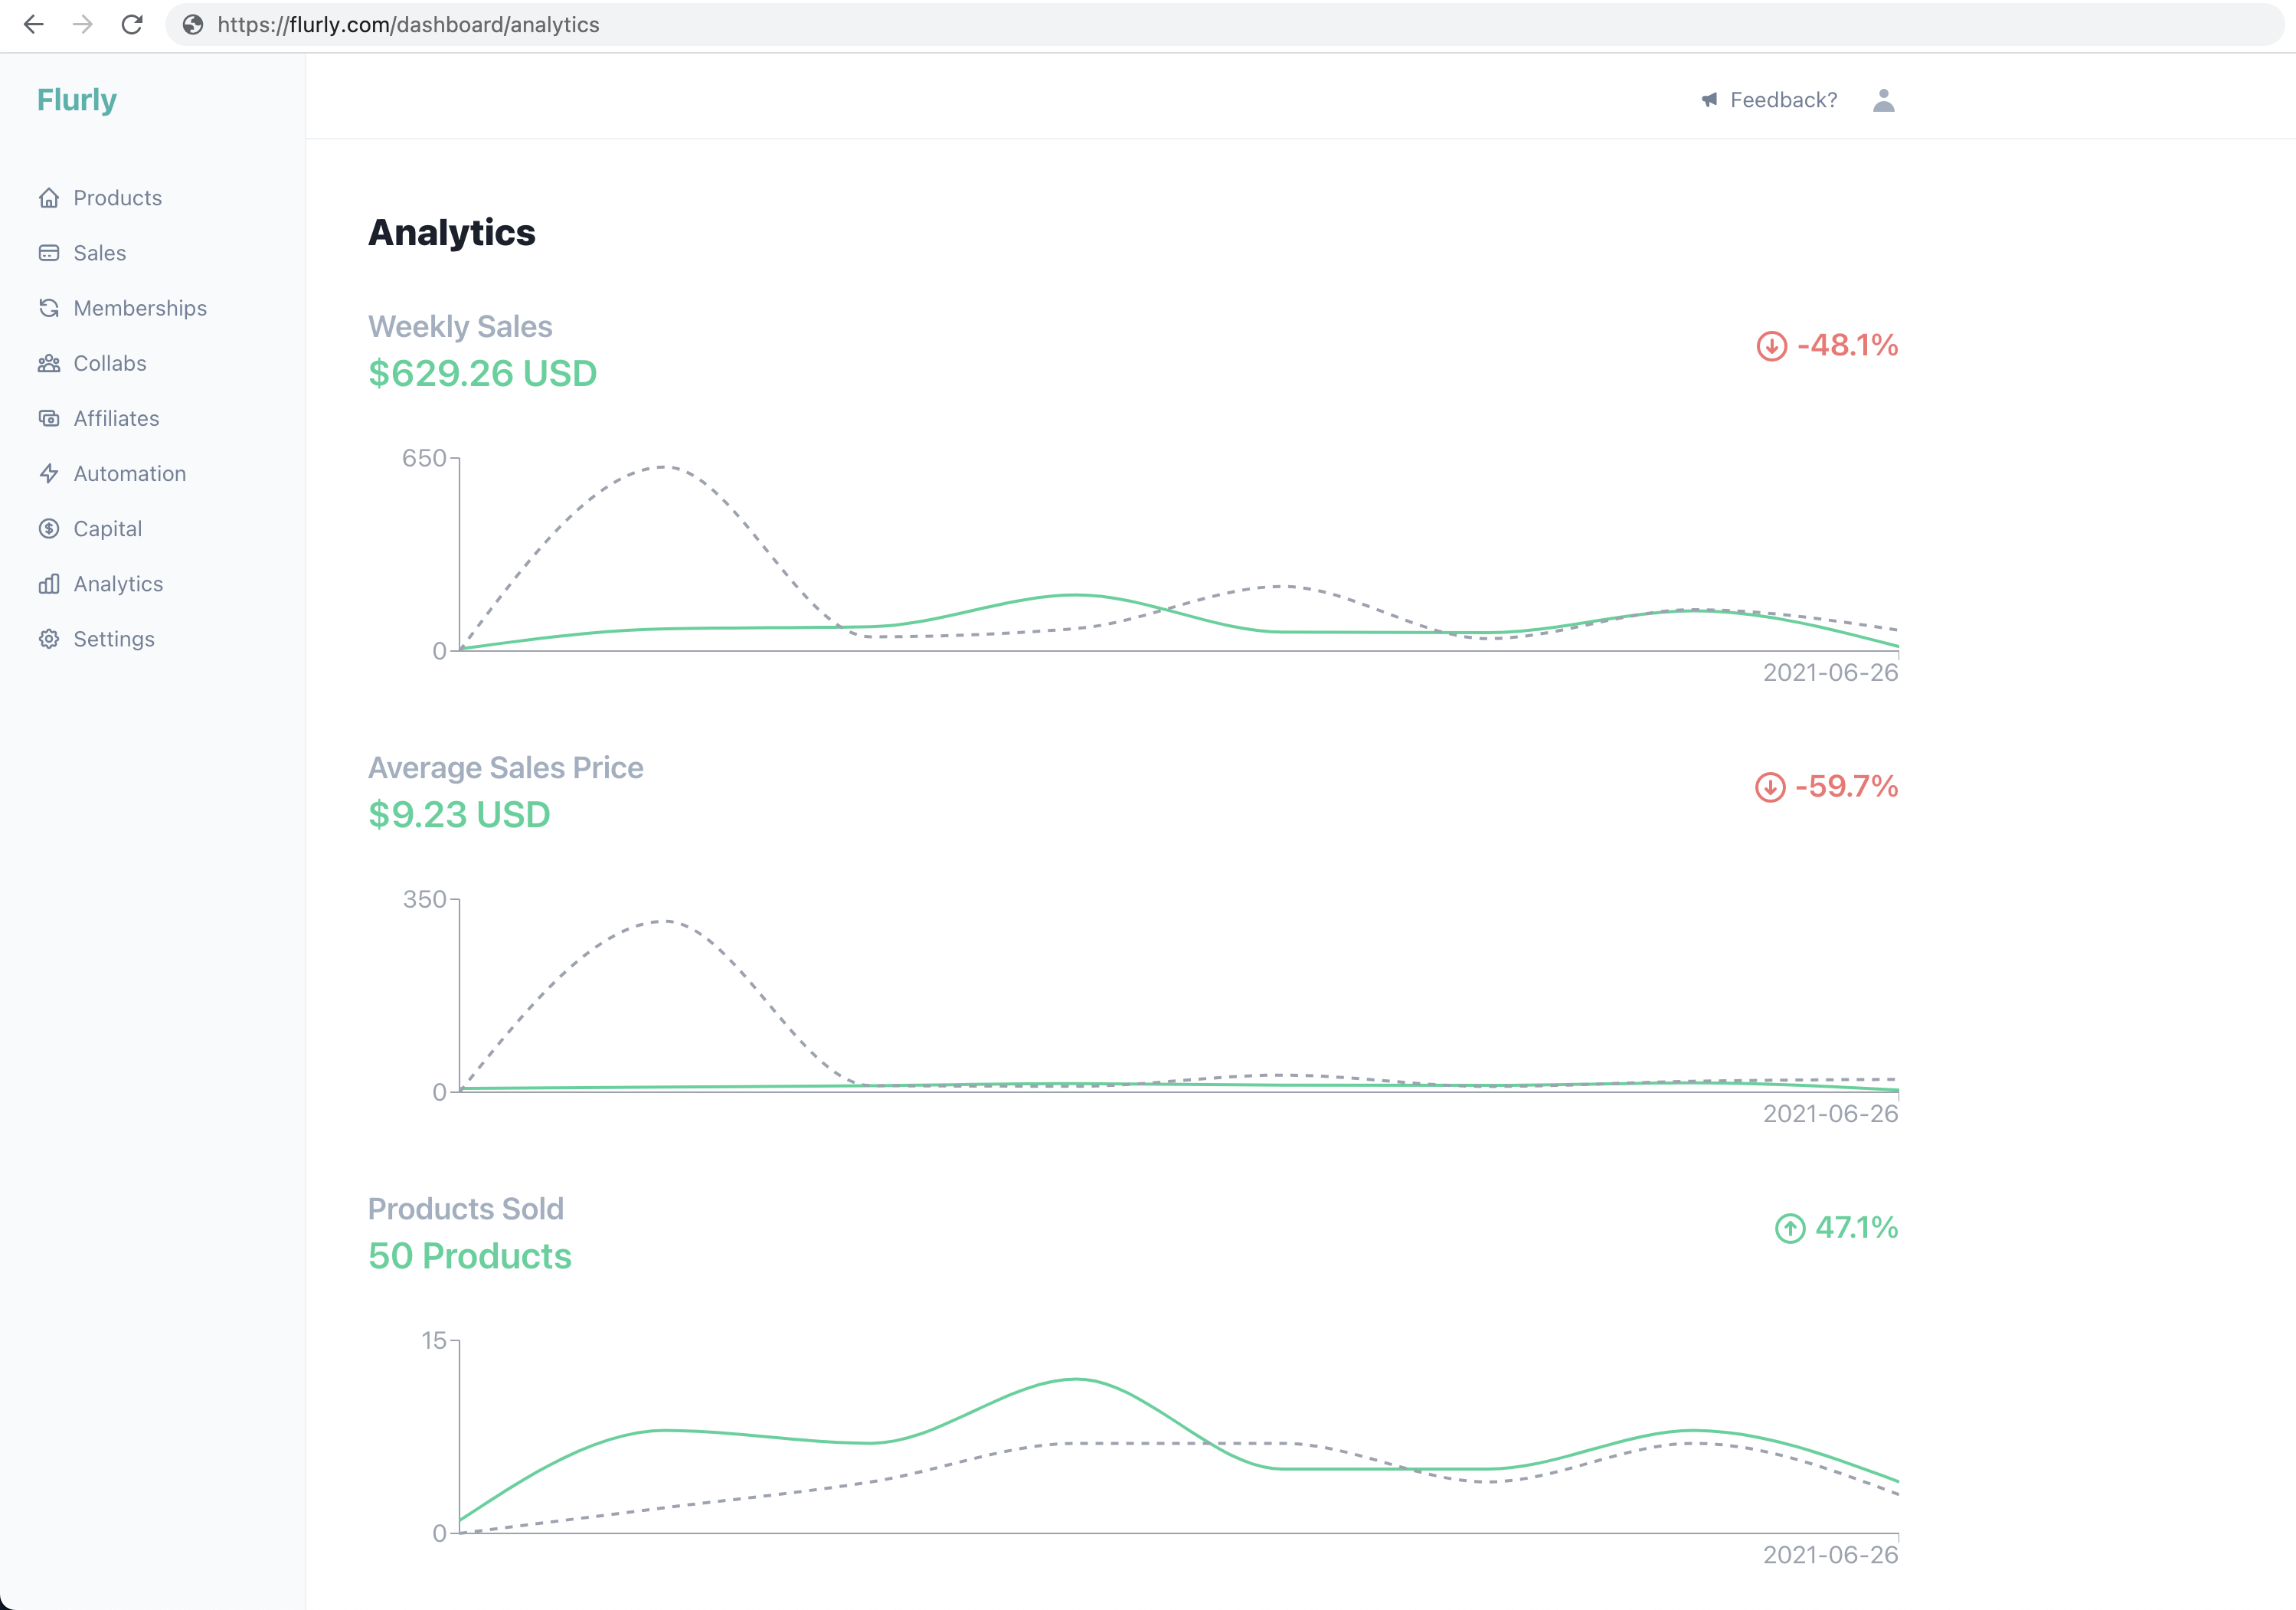
Sooner or later, every SaaS product needs to show users their own numbers. Usage this month, activity over time, spend to date. Your users expect it, and it's one of those features that quietly drives retention.
The DIY route is painful. You pick a charting library and fight with it for a day. You write time-series queries against your primary database and watch them get slower as your data grows. Then a PM asks for one more graph and you do it all over again. This exact pain was the original inspiration behind GraphJSON.
Here's the three-step version that takes an afternoon instead of a sprint.
Step 1: Log events with a user identifier#
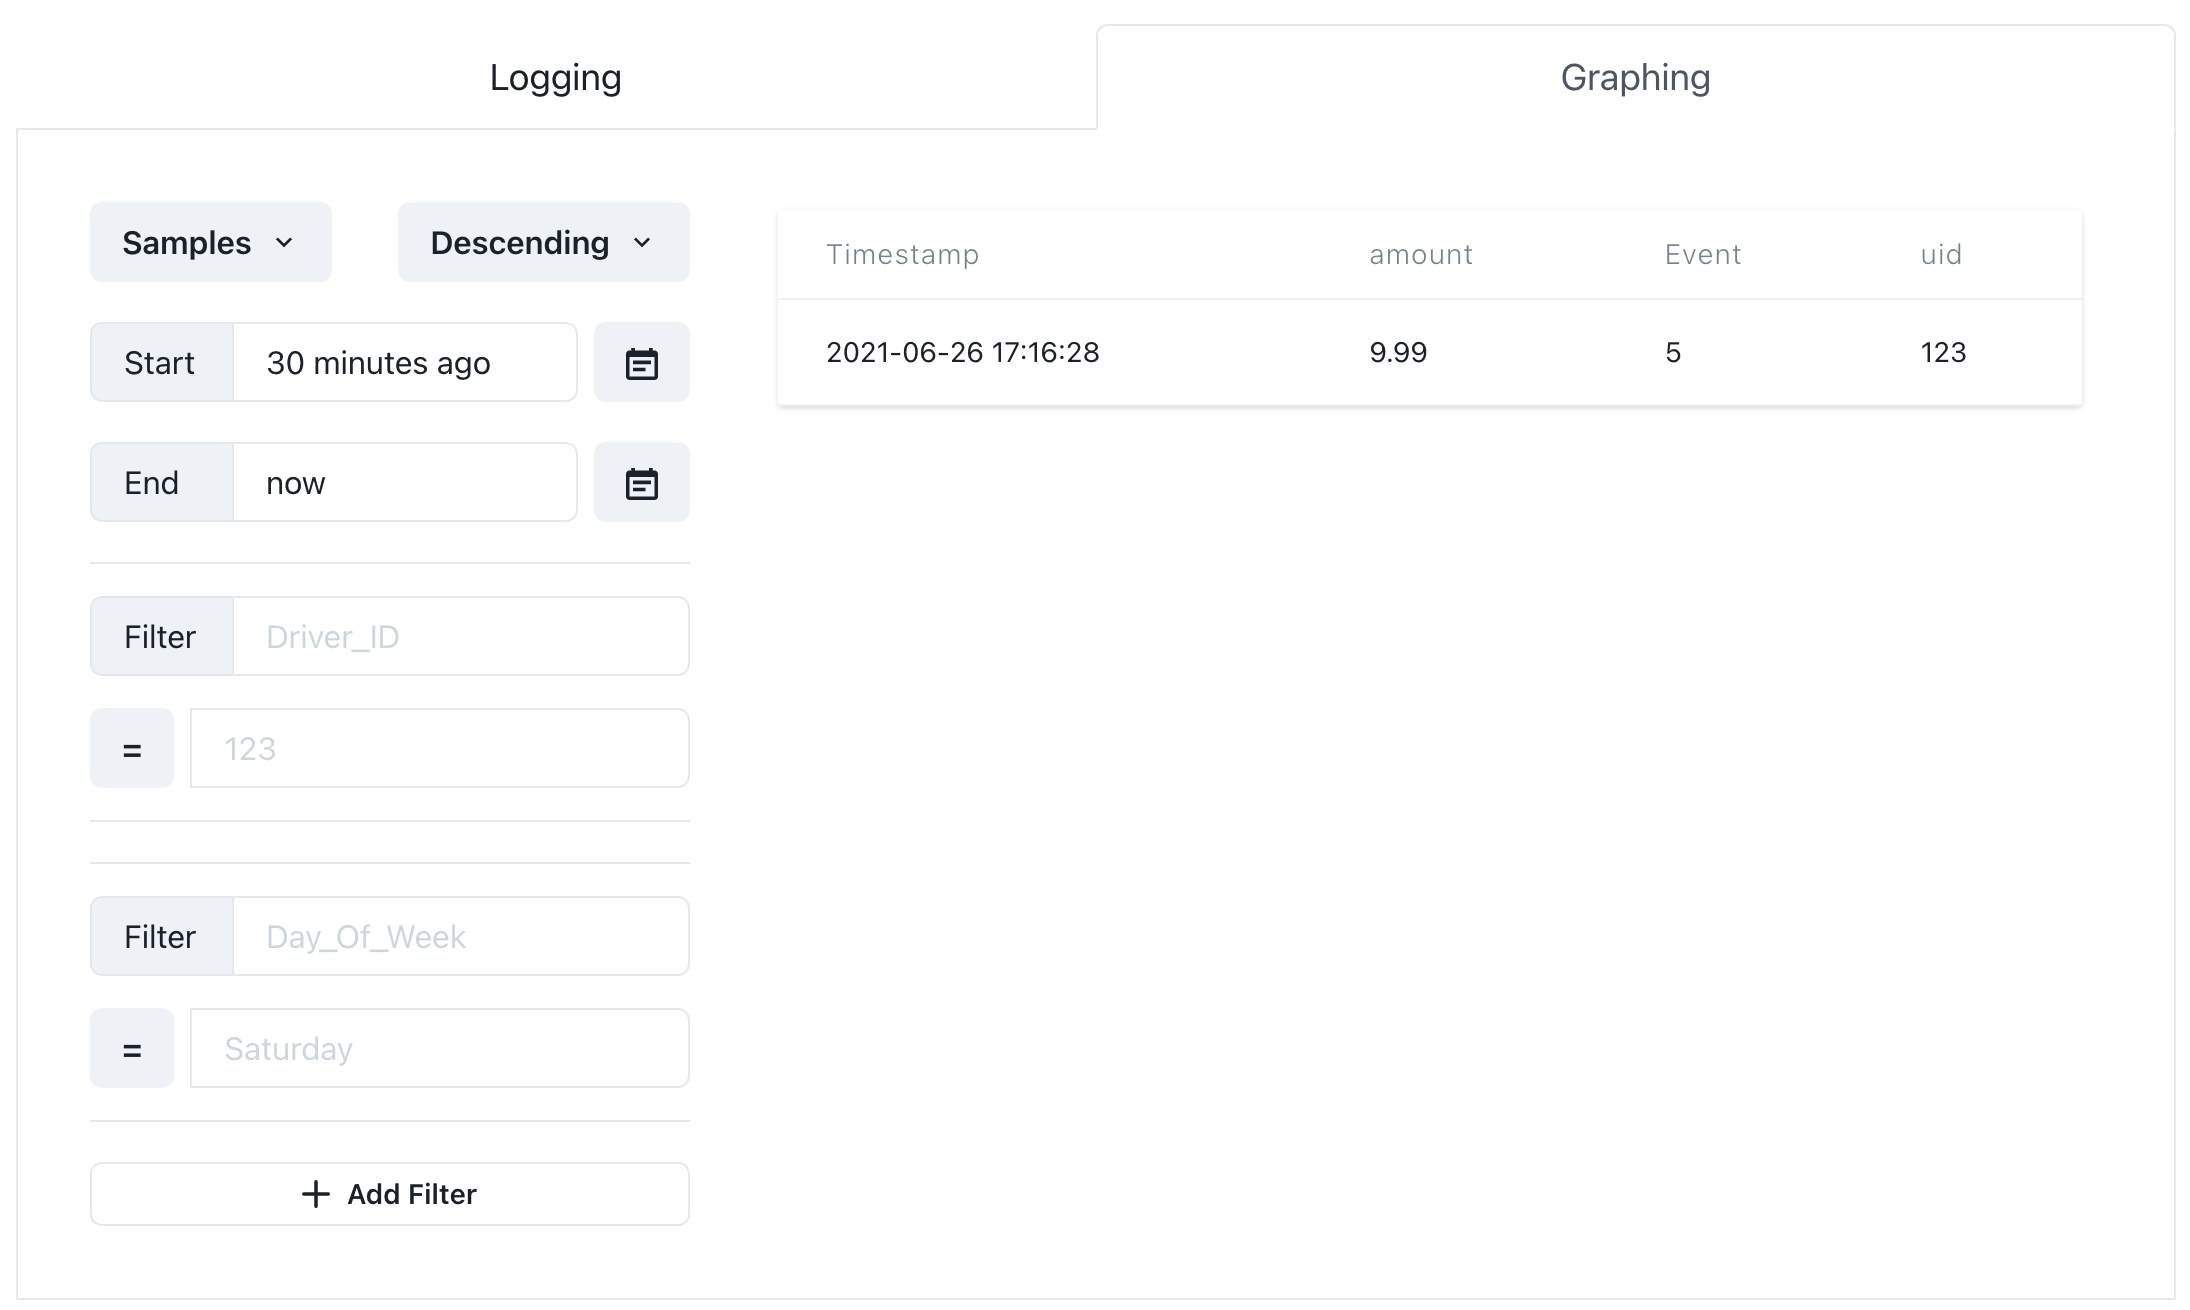
Send a server-side JSON POST to https://api.graphjson.com/api/log for every event you care about, and include stable user_id and account_id fields where the analysis needs them. Keep the GraphJSON API key on your server. GraphJSON does not require a declared storage schema, but the identifiers and event meanings are still a contract your team should document.
Step 2: Build the graph once#
Open the visualizer, build the graph you want your users to see, and add a filter on your user id field. The typeahead will even suggest the values as you type.
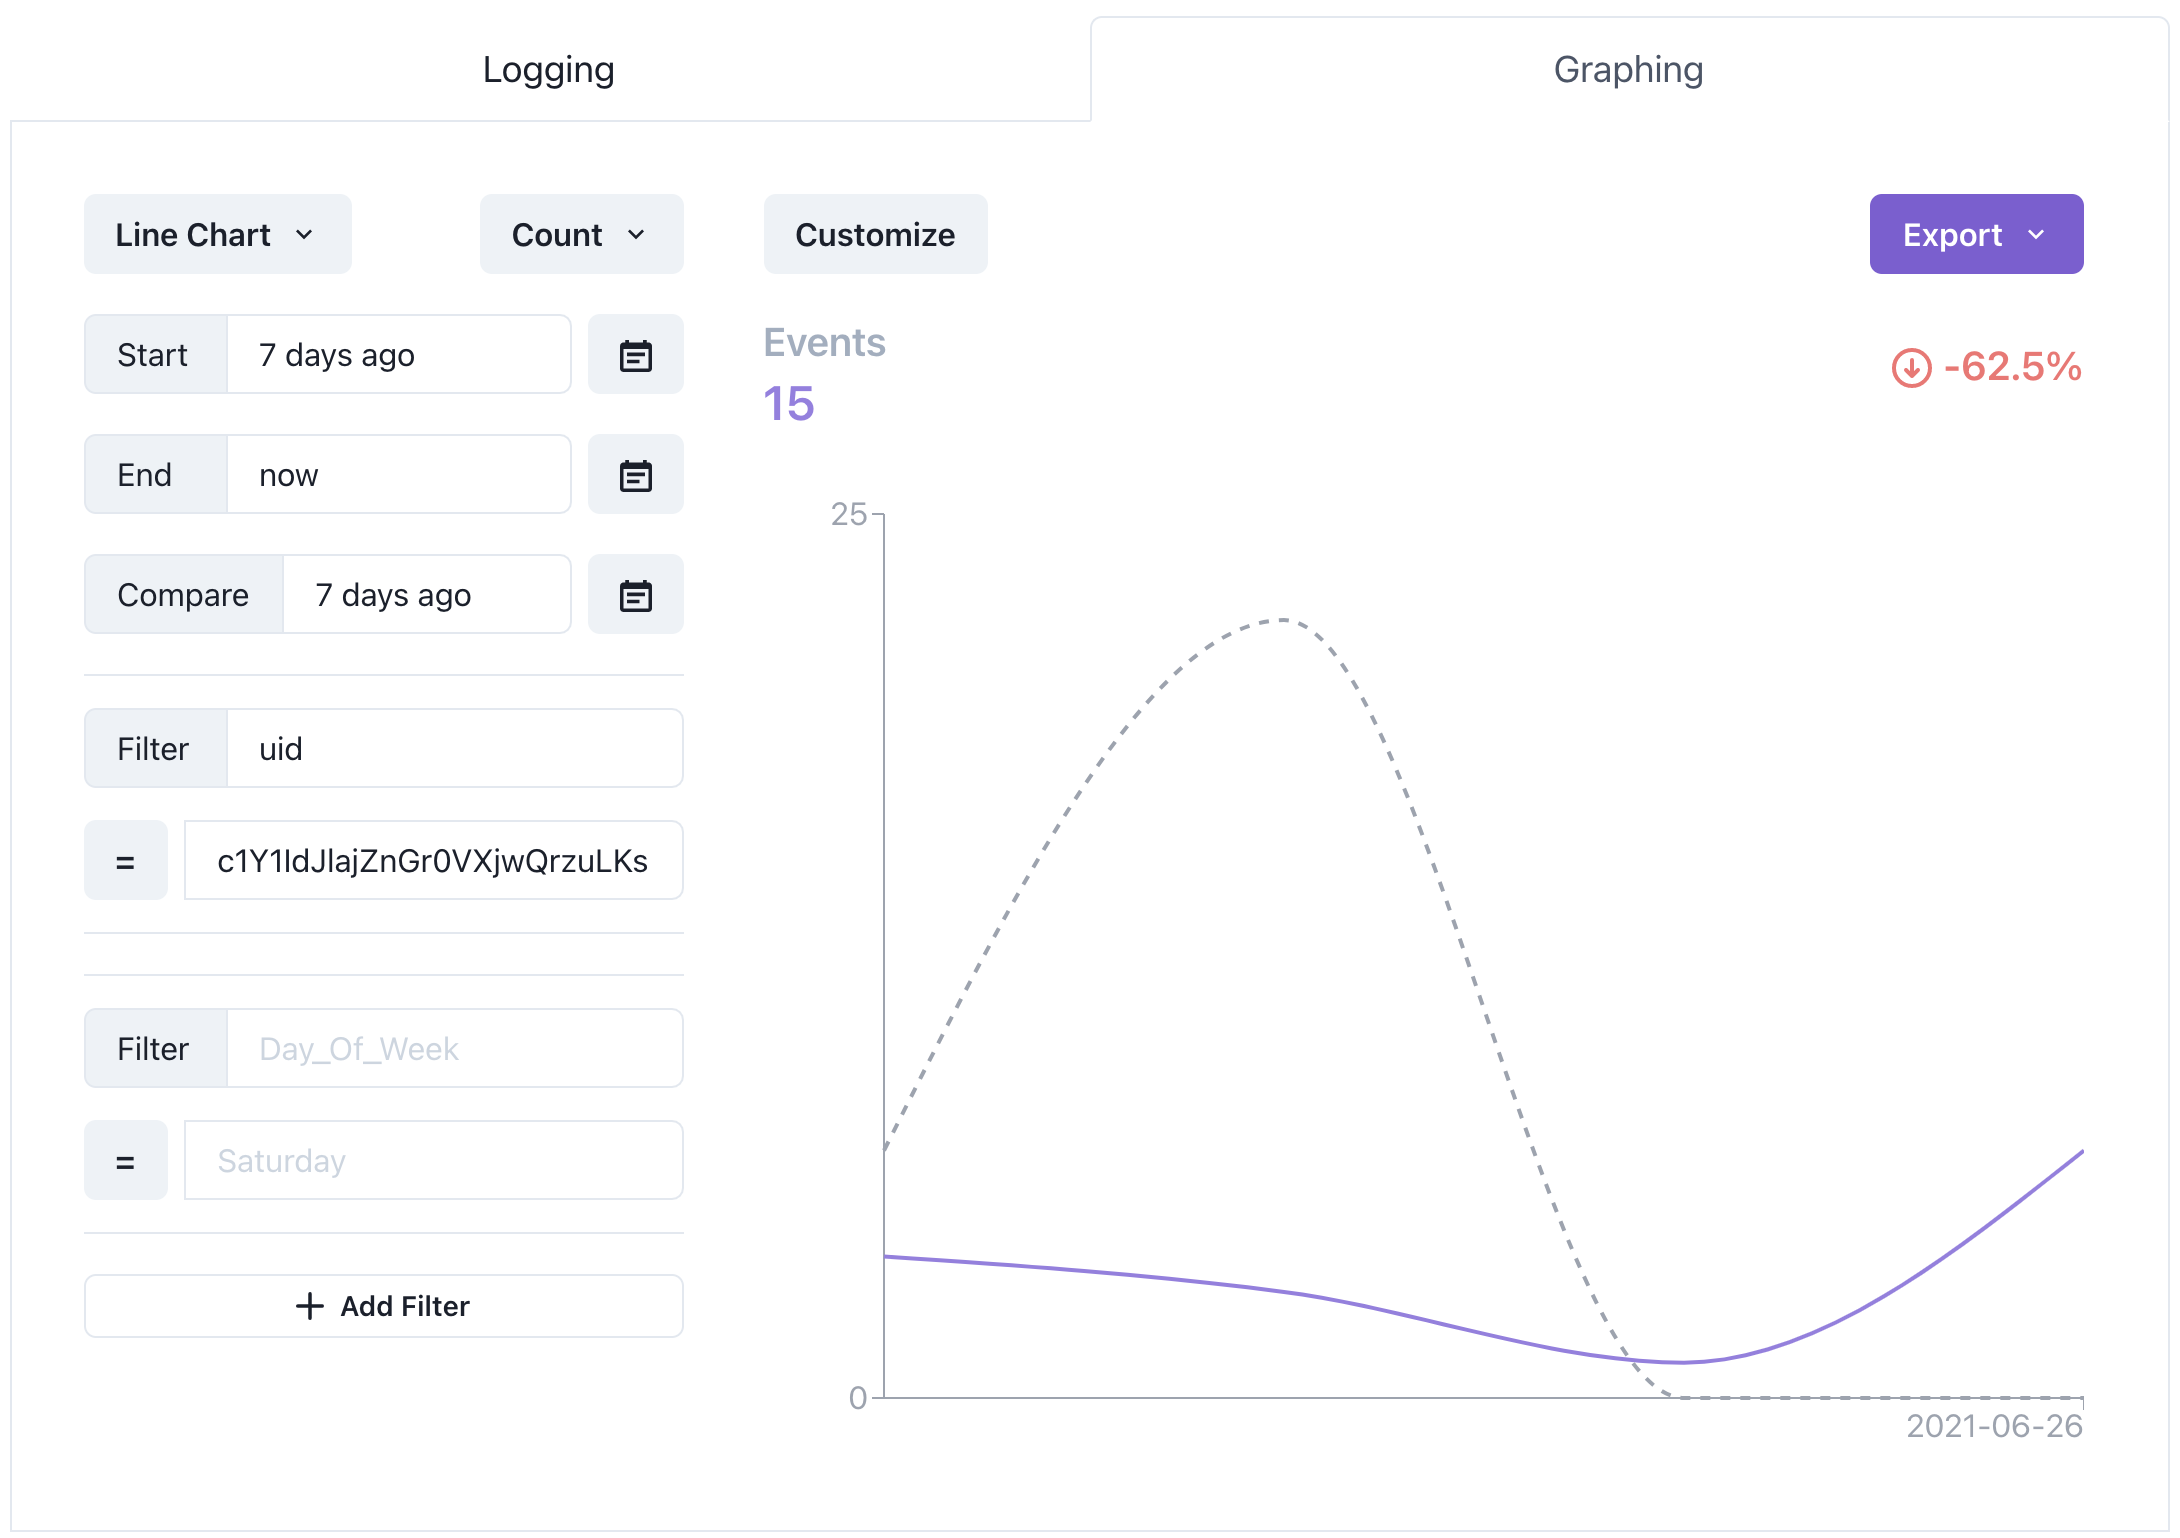
At this point you have a graph that shows one user's data. The trick is making it show whoever is logged in.
Step 3: Swap the filter per request with the Embed API#
Instead of pasting a static iframe, your backend calls the Embed API with the graph configuration and the current user's id as the filter. You get back a URL, render it as an iframe in your page, and each user sees only their own data - no custom charting code, no analytical queries hammering your production database.
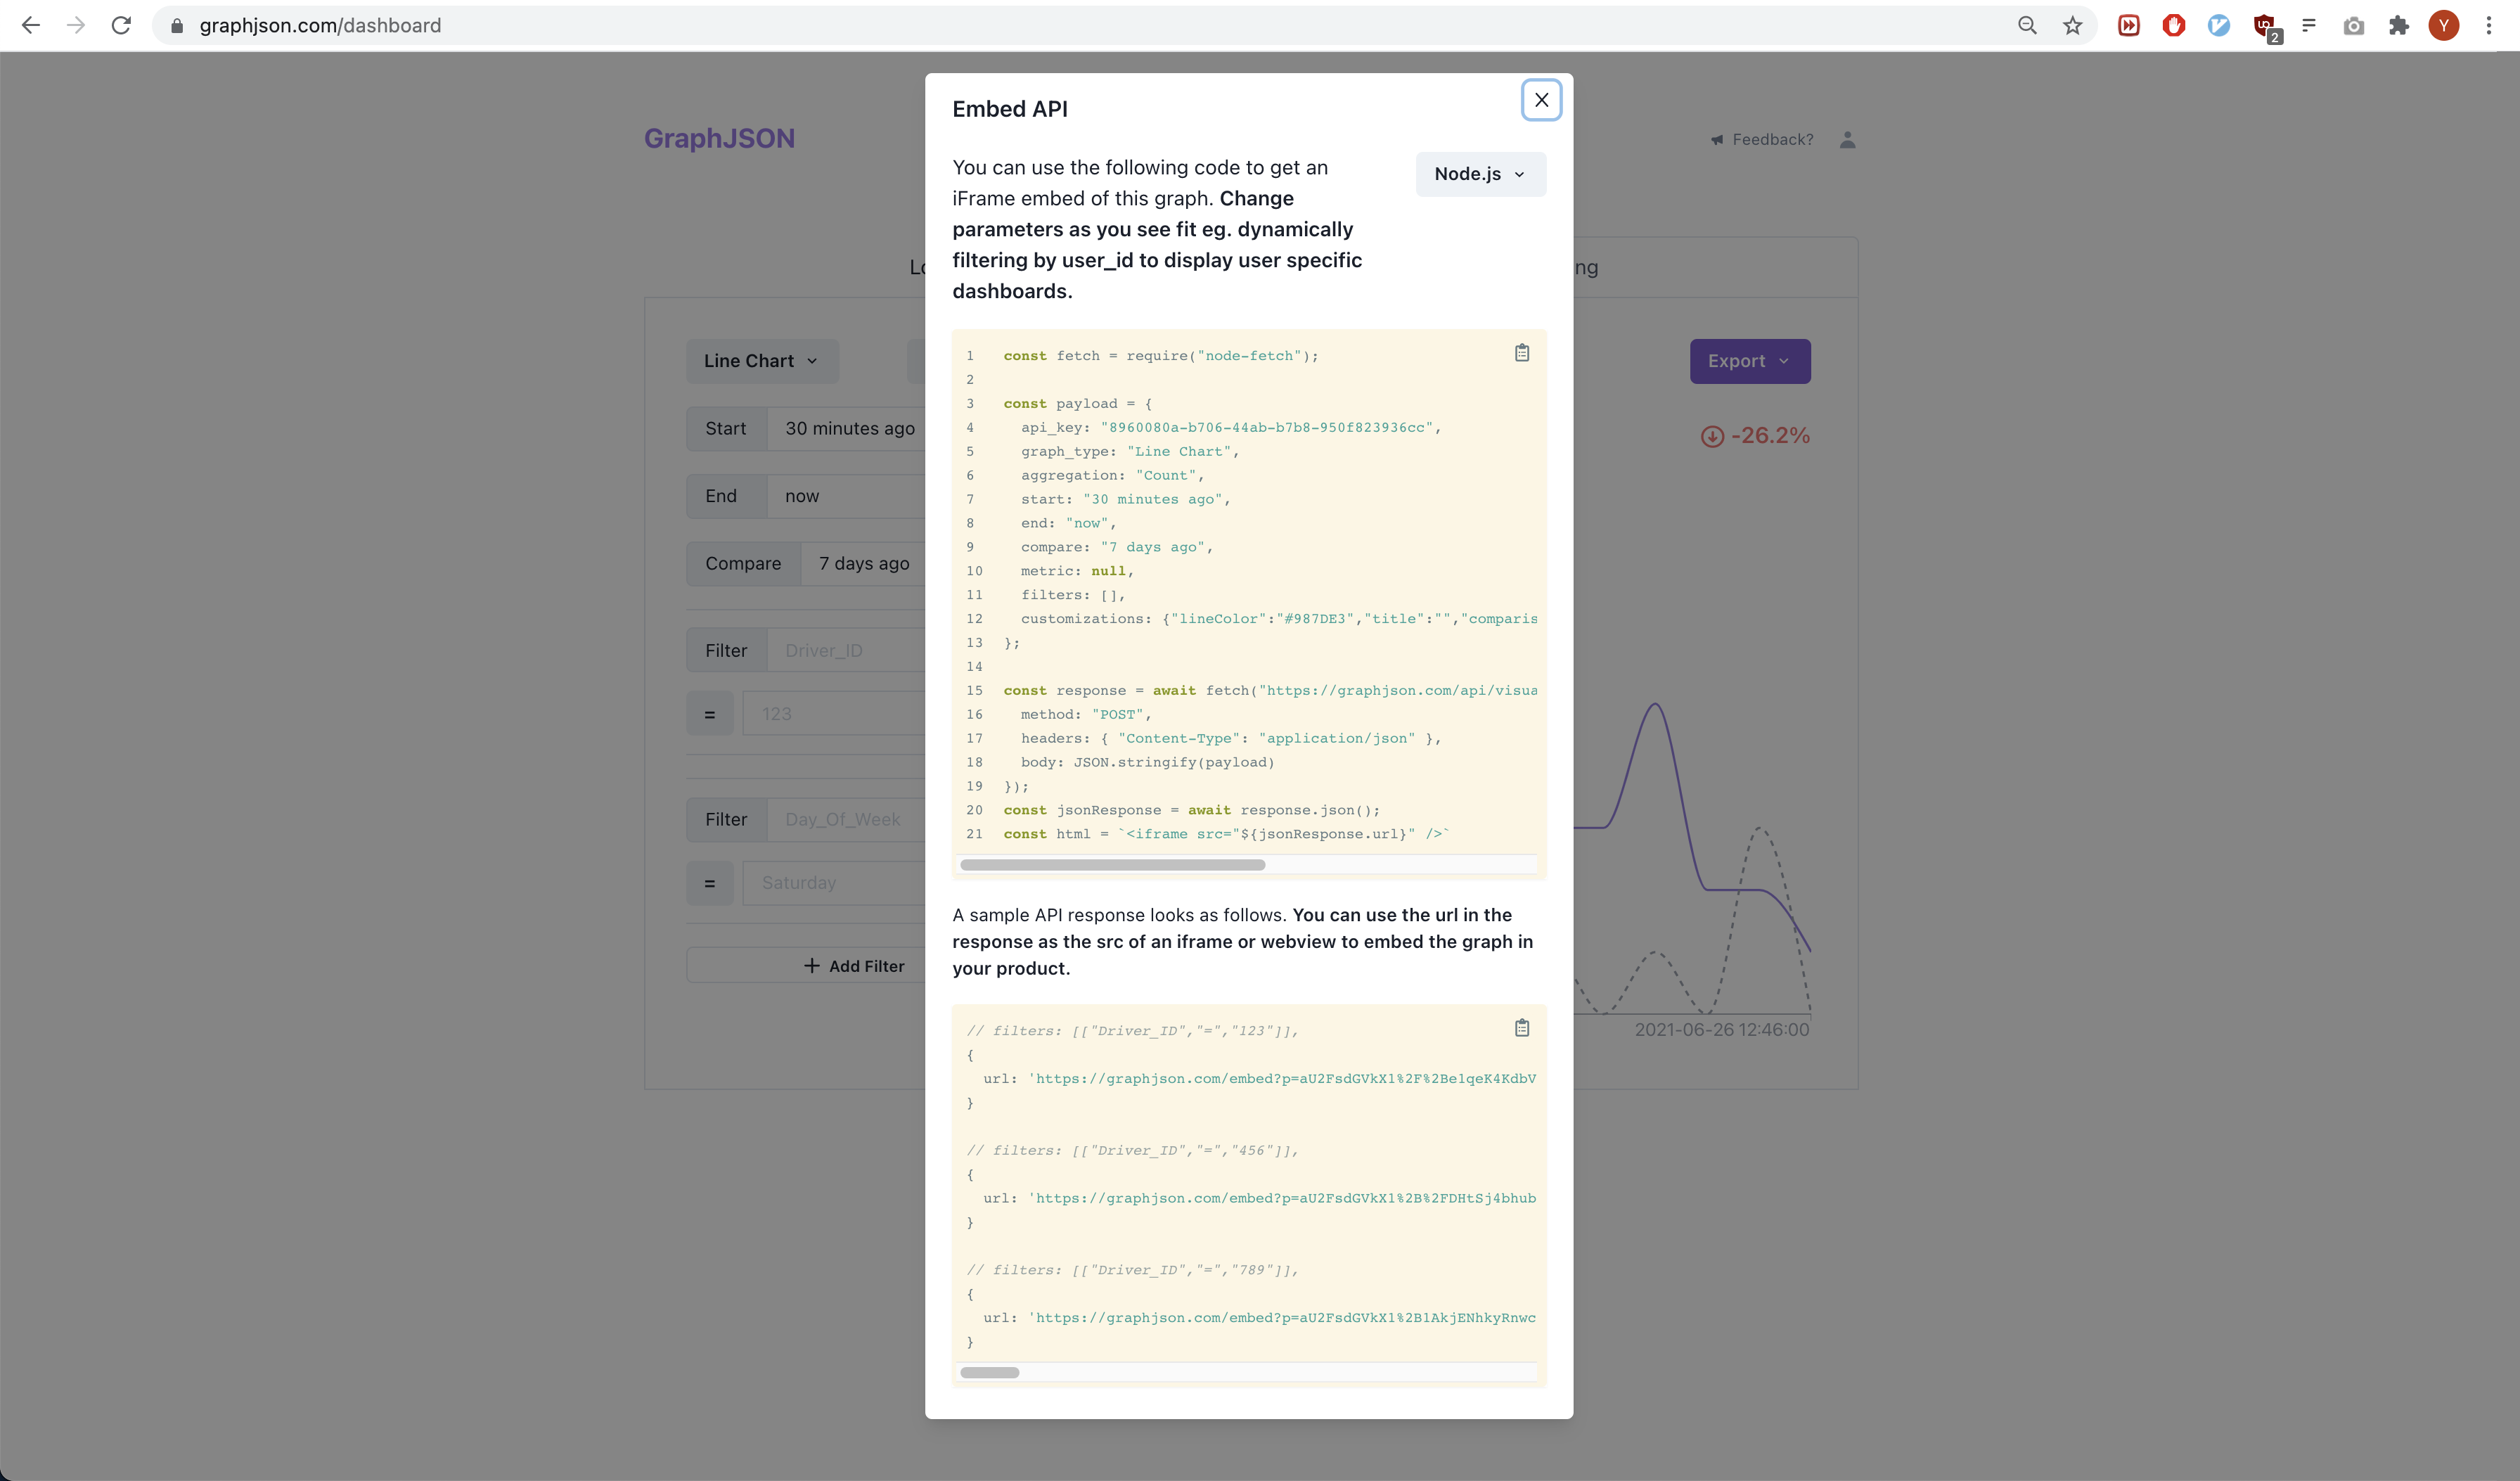
The full API details are in our guides on personalized dashboards and embedding graphs.
This is already running in production#
Flurly powers their seller analytics with GraphJSON. Every seller sees their own weekly sales, average sale price, and products sold - all rendered as embedded GraphJSON graphs filtered to their account.
One Simple API uses GraphJSON the same way to power their user dashboards. And because embeds are cached with a 15 minute TTL by default, this scales to millions of dashboard views without your database noticing.
If your numbers are safe to share publicly, you can use the same embeds to build a live /open metrics page - we walk through that in How to Build a Live Metrics /Open Page.

Written by JR
Founder and builder of GraphJSON.


