Visualize
Explore before you model
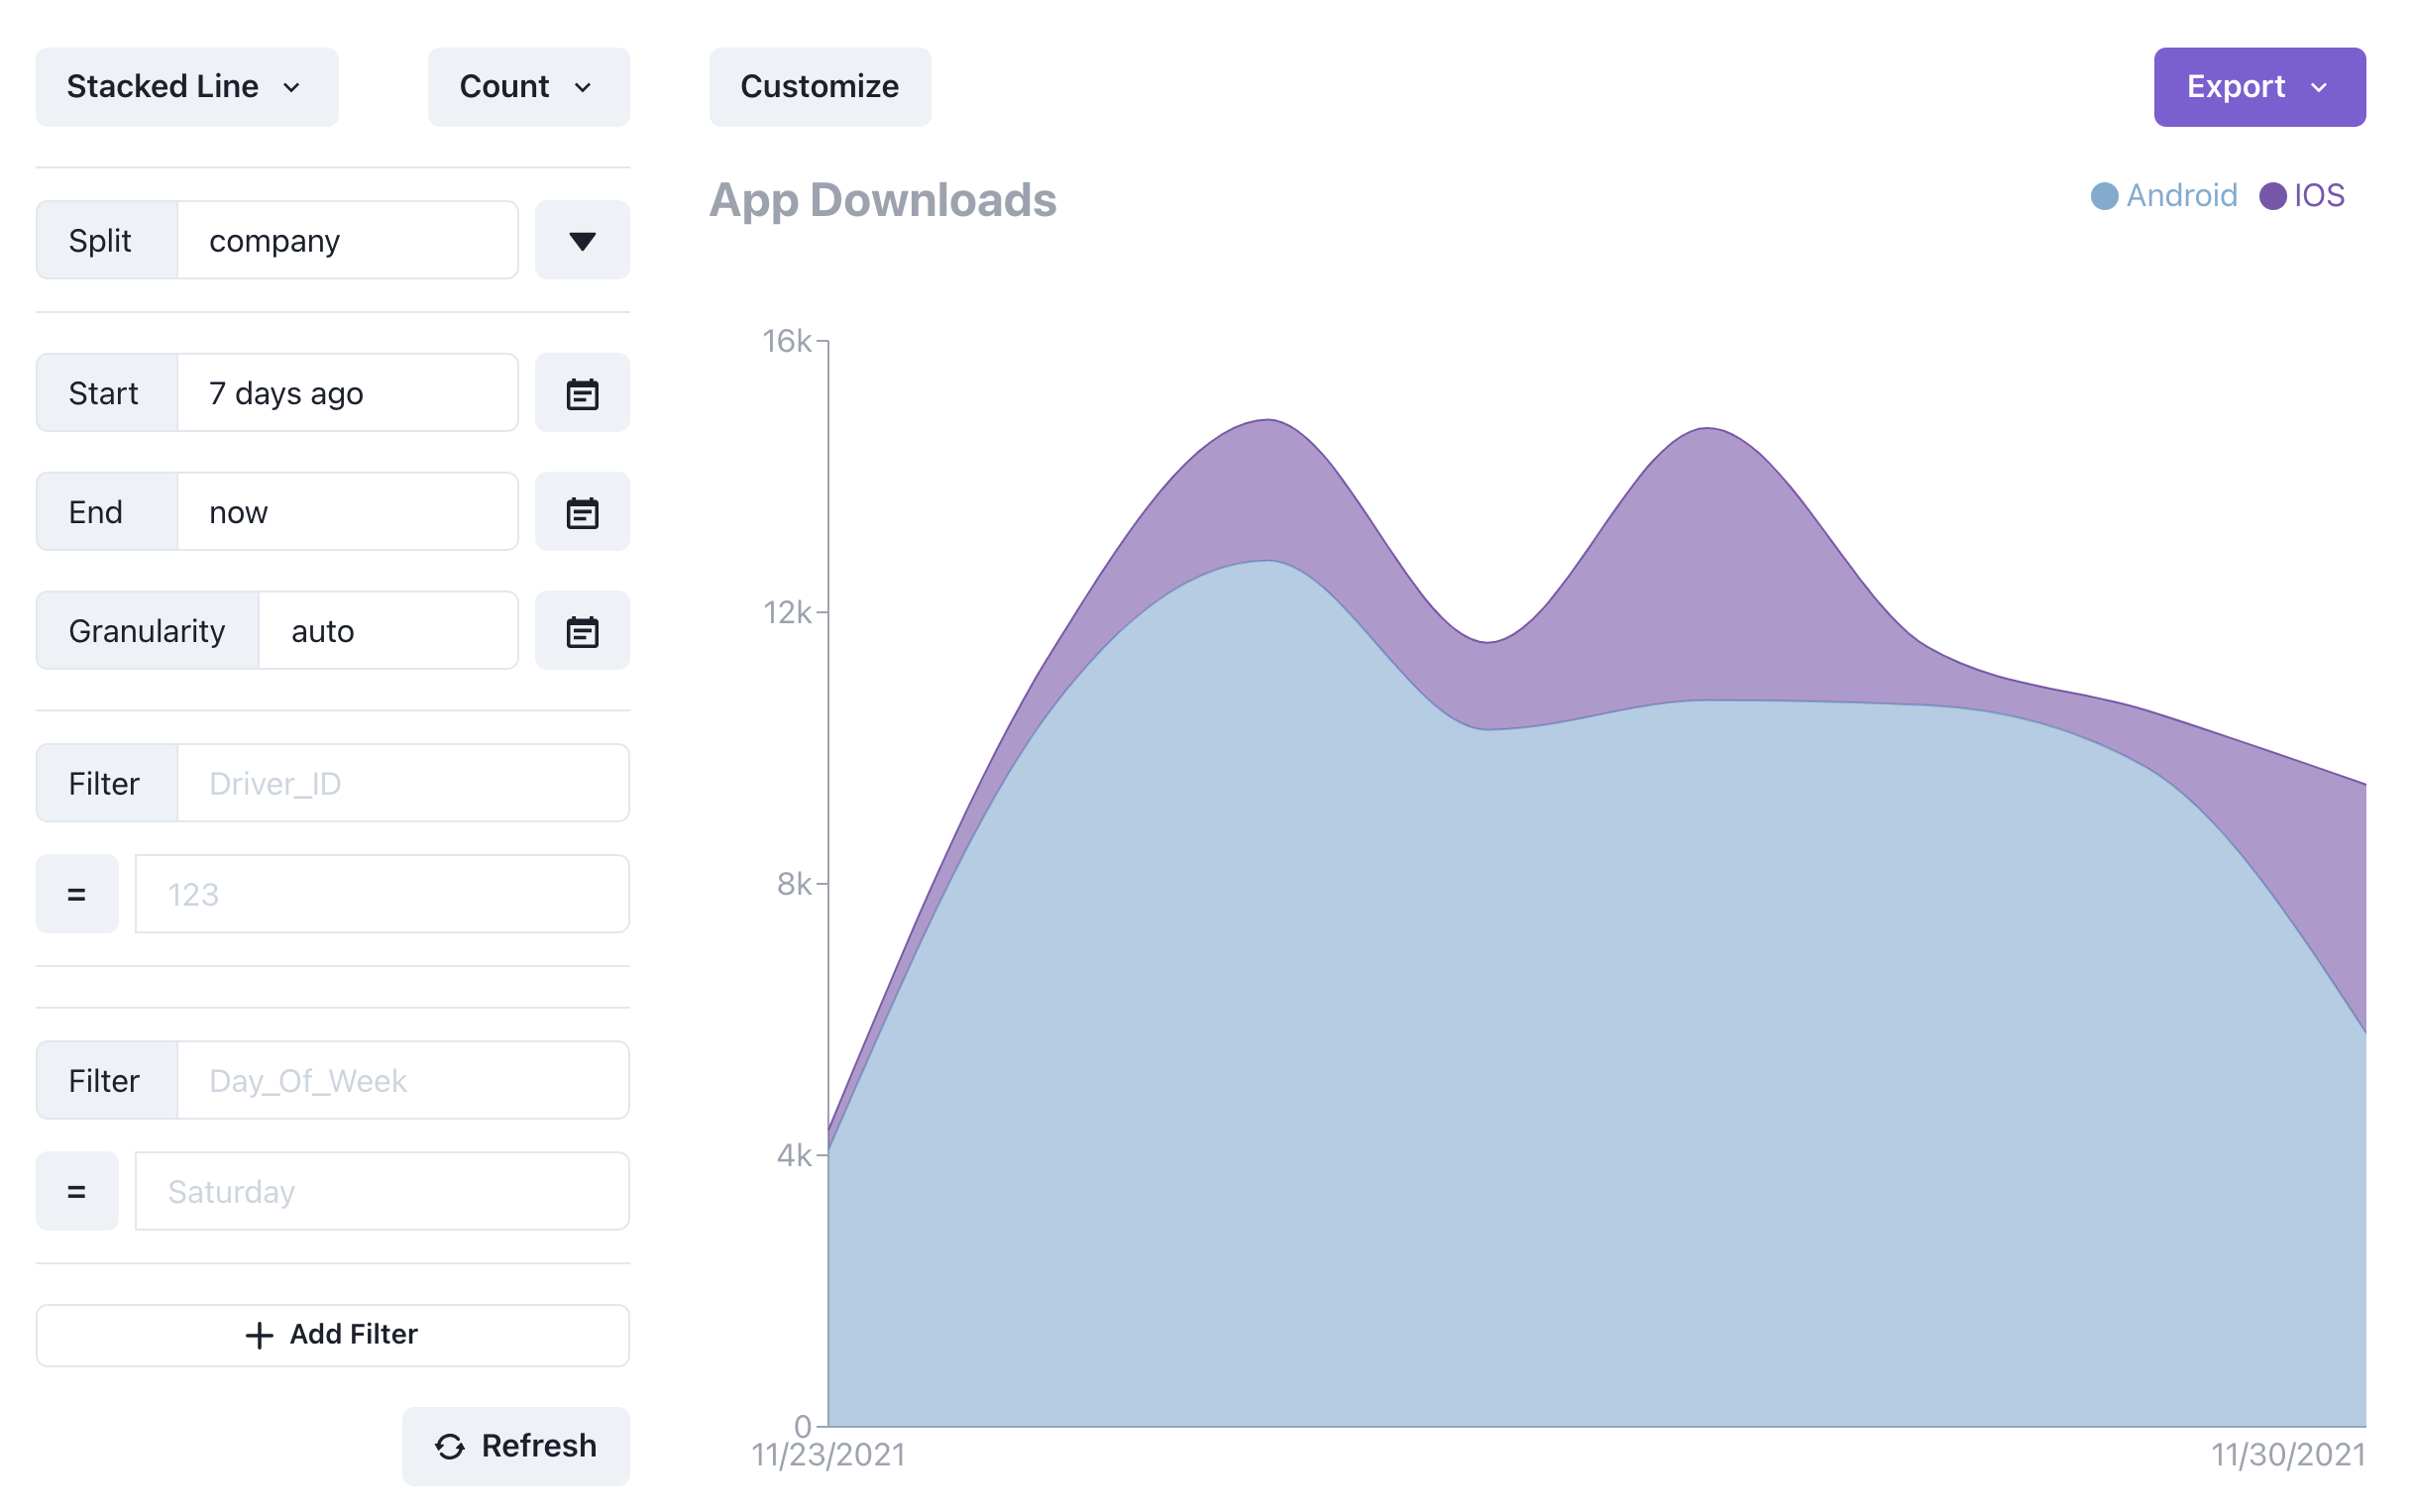
Every JSON field is available the moment an event lands. Filter, group, compare, and turn the result into a chart without defining a warehouse schema first.
No credit card required · Free up to 5k events
From first event to a useful graph in minutes.
Built by engineers from




Platform
Start with the data you already have. Add structure only when it earns its keep.
Visualize
Every JSON field is available the moment an event lands. Filter, group, compare, and turn the result into a chart without defining a warehouse schema first.
Query
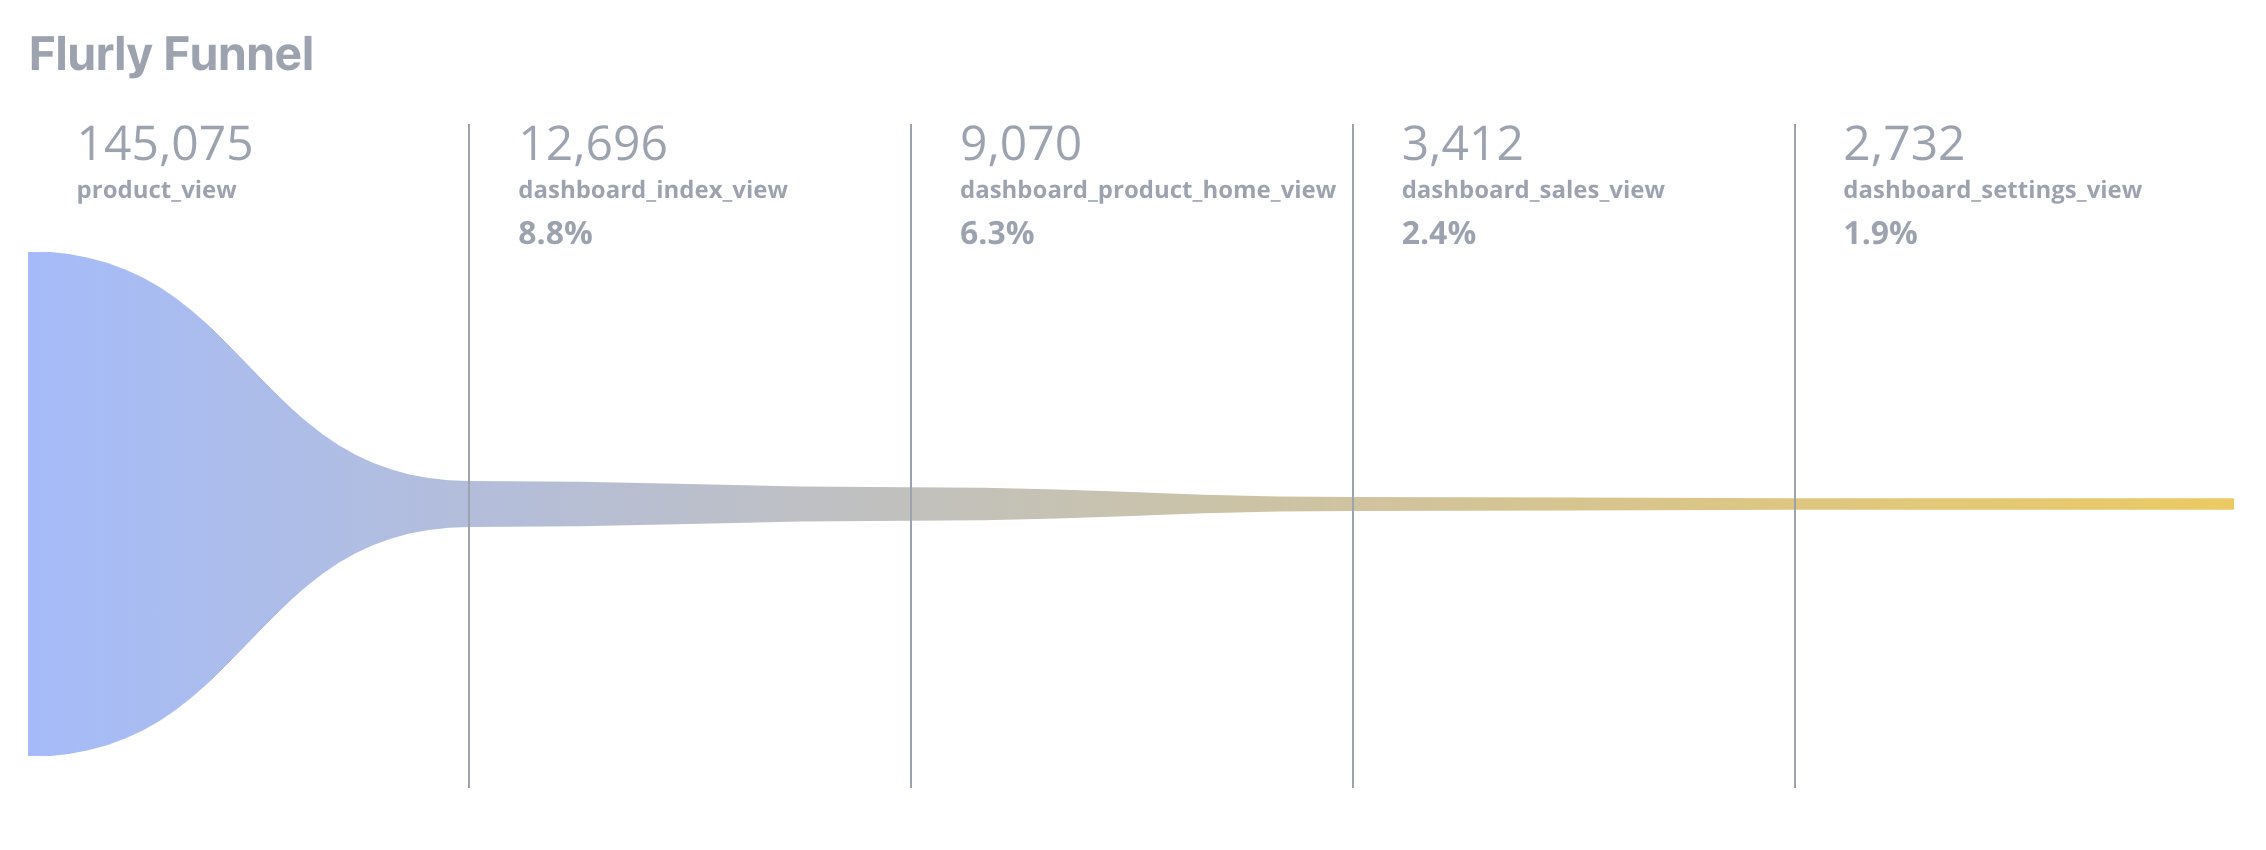
Move from point-and-click exploration to full ClickHouse SQL without exporting anything. Write joins, window functions, funnels, and cohort queries, then chart the results in the same notebook.
Monitor
Compose live dashboards, alert on important changes, and securely embed customer-facing analytics. One event stream can serve your team, your users, and your operations.
Scale
Start free, then pay a published rate based on stored event volume. Retention controls help you keep the data that matters and remove the data that does not.
Stored events
2,000,608
Published rate
$12 / million
Connect
Use one-click integrations for Vercel, Segment, and Stripe, or send a plain HTTP request from any language. No SDK is required.



Capabilities
The core pieces you need to collect events, investigate behavior, and share what you learn.
Columnar storage and purpose-built queries keep interactive analysis responsive as your event history grows.
Watch important metrics and get notified when a value crosses the threshold you define.
Send JSON from any language with a generated request snippet. There is no client library to install or keep updated.
Run joins, window functions, and custom aggregations directly over your events, then visualize the result.
Arrange the charts your team needs in a drag-and-drop workspace, without rebuilding every query in frontend code.
Separate event streams by product, environment, team, or retention policy while keeping one consistent analysis workflow.
Keep API keys on the server, separate data by collection, and choose retention windows that fit each workload.
New events become explorable as they arrive, so dashboards and investigations are based on what is happening now.
From customers
Developers use GraphJSON for internal metrics, customer dashboards, product analytics, and operational logs.

Can I recommend @GraphJSON ? Good, simple, super responsive indie developer

I really love the simplicity of @GraphJSON. You just push the all your data to it and you would be able to make all sorts of graphs and visualizations out of that data.

I am now a happy customer of @GraphJSON by @TheBuilderJR. Super simple analytics and visualisation system for devs

Think @GraphJSON could work well for you. Disclaimer: I didn't build it but am a big fan

You honestly impress me so much with your dedication to quality. Happy user of @GraphJSON for like 4 months now

I've also used @GraphJSON for recording logs, visualizing them, and querying them. It's very performant and quick to get started with
Create an account, send up to 5,000 events free, and see every field become queryable.
Spark free tier
$0
Free up to 5,000 stored events