How to Build a Live Metrics /Open Page for Your Startup
Learn how to build a public /open metrics page with live graphs using GraphJSON, like BannerBear and NomadList.
Startups like BannerBear and NomadList publish live metrics pages that anyone on the internet can see. Revenue, signups, transactions - all out in the open. Two of our customers, Mdx and Web3forms, built their open pages on top of GraphJSON.
Why do it? Three reasons. It builds trust with users and investors (nothing says "we have nothing to hide" like public numbers). It's basically free marketing - people tweet your milestones for you. And it keeps your team accountable, because the scoreboard is always on.
The best part: you can build one in an afternoon. The recipe is three steps - log your events, build your graphs, embed them on a public page.
Step 1: Log your events#
Everything starts with a server-side JSON POST to https://api.graphjson.com/api/log with your API key, a timestamp, and the JSON payload you want to track. Transactions, signups, page views - anything that can send an HTTP request can log to GraphJSON, and since there's no schema to declare up front, you can start sending events in minutes. Keep the API key out of browser code; the exact payload and security pattern are in the logging docs.
For this walkthrough we put together a demo project called Centralized Coin and logged an event every time a transaction was sent, with the transaction amount attached.
Step 2: Build your graph#
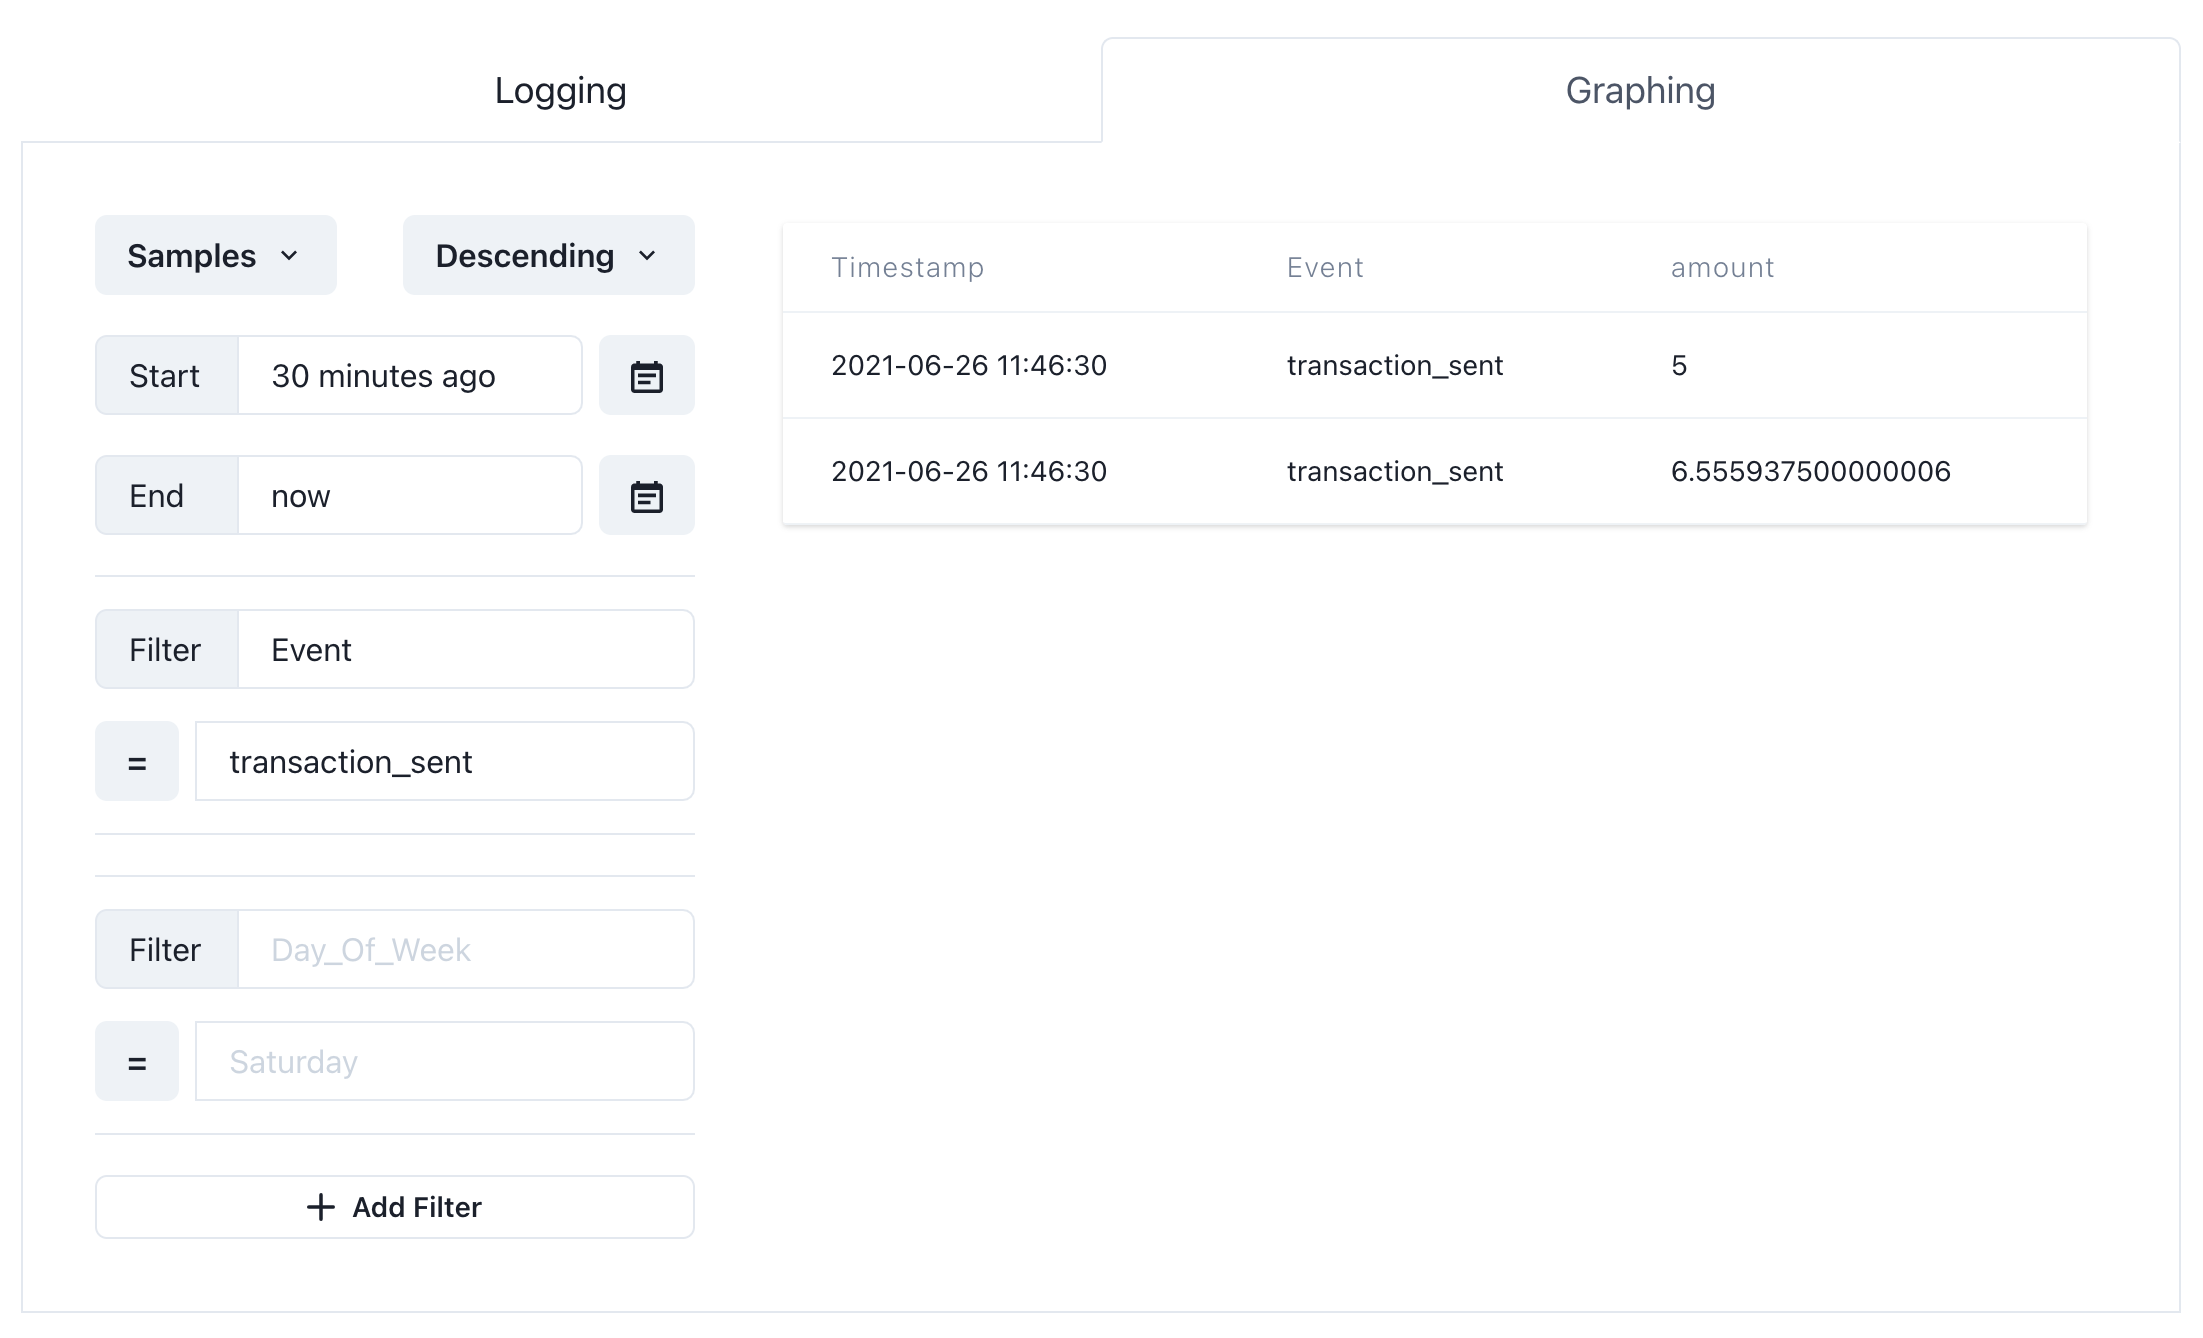
Open the visualizer and filter down to the events you care about. Here we're looking at raw transaction_sent events - notice the typeahead suggestions, so you don't need to remember exact field names or values.
Now flip to a graph. Pick a chart type, choose your aggregation (Count, Avg, or Sum - we want total volume, so Sum over the amount field), and optionally compare against a previous period to get the trend indicator.
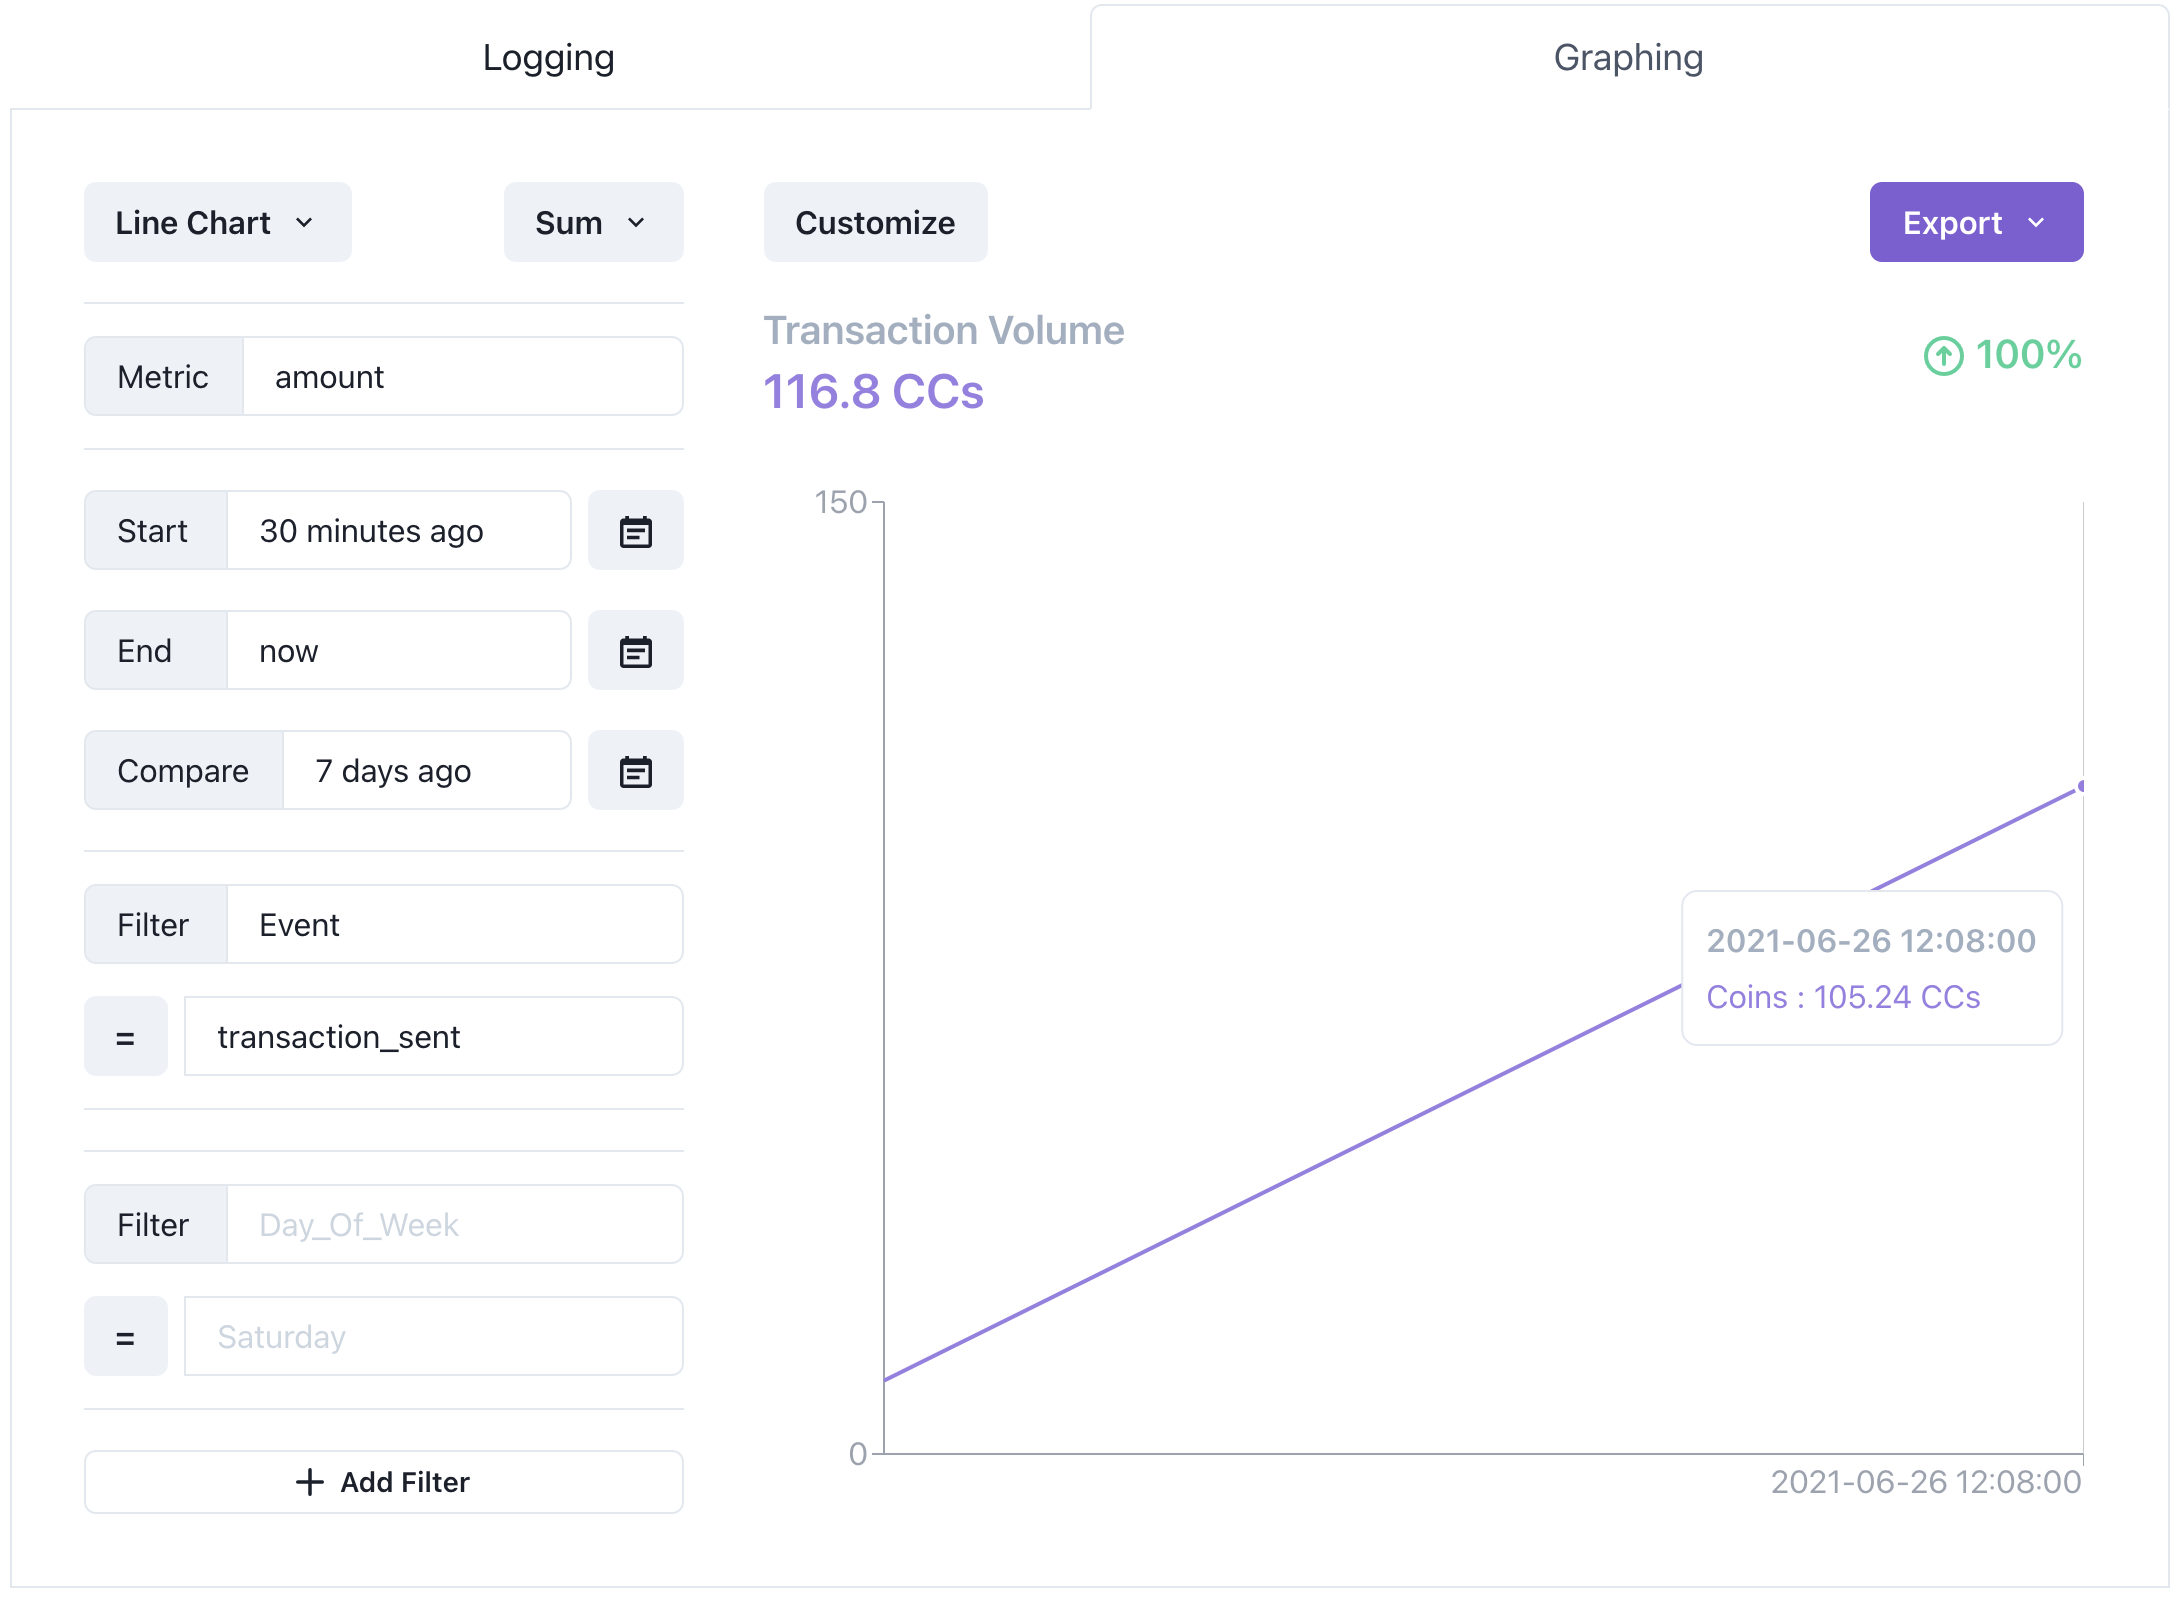
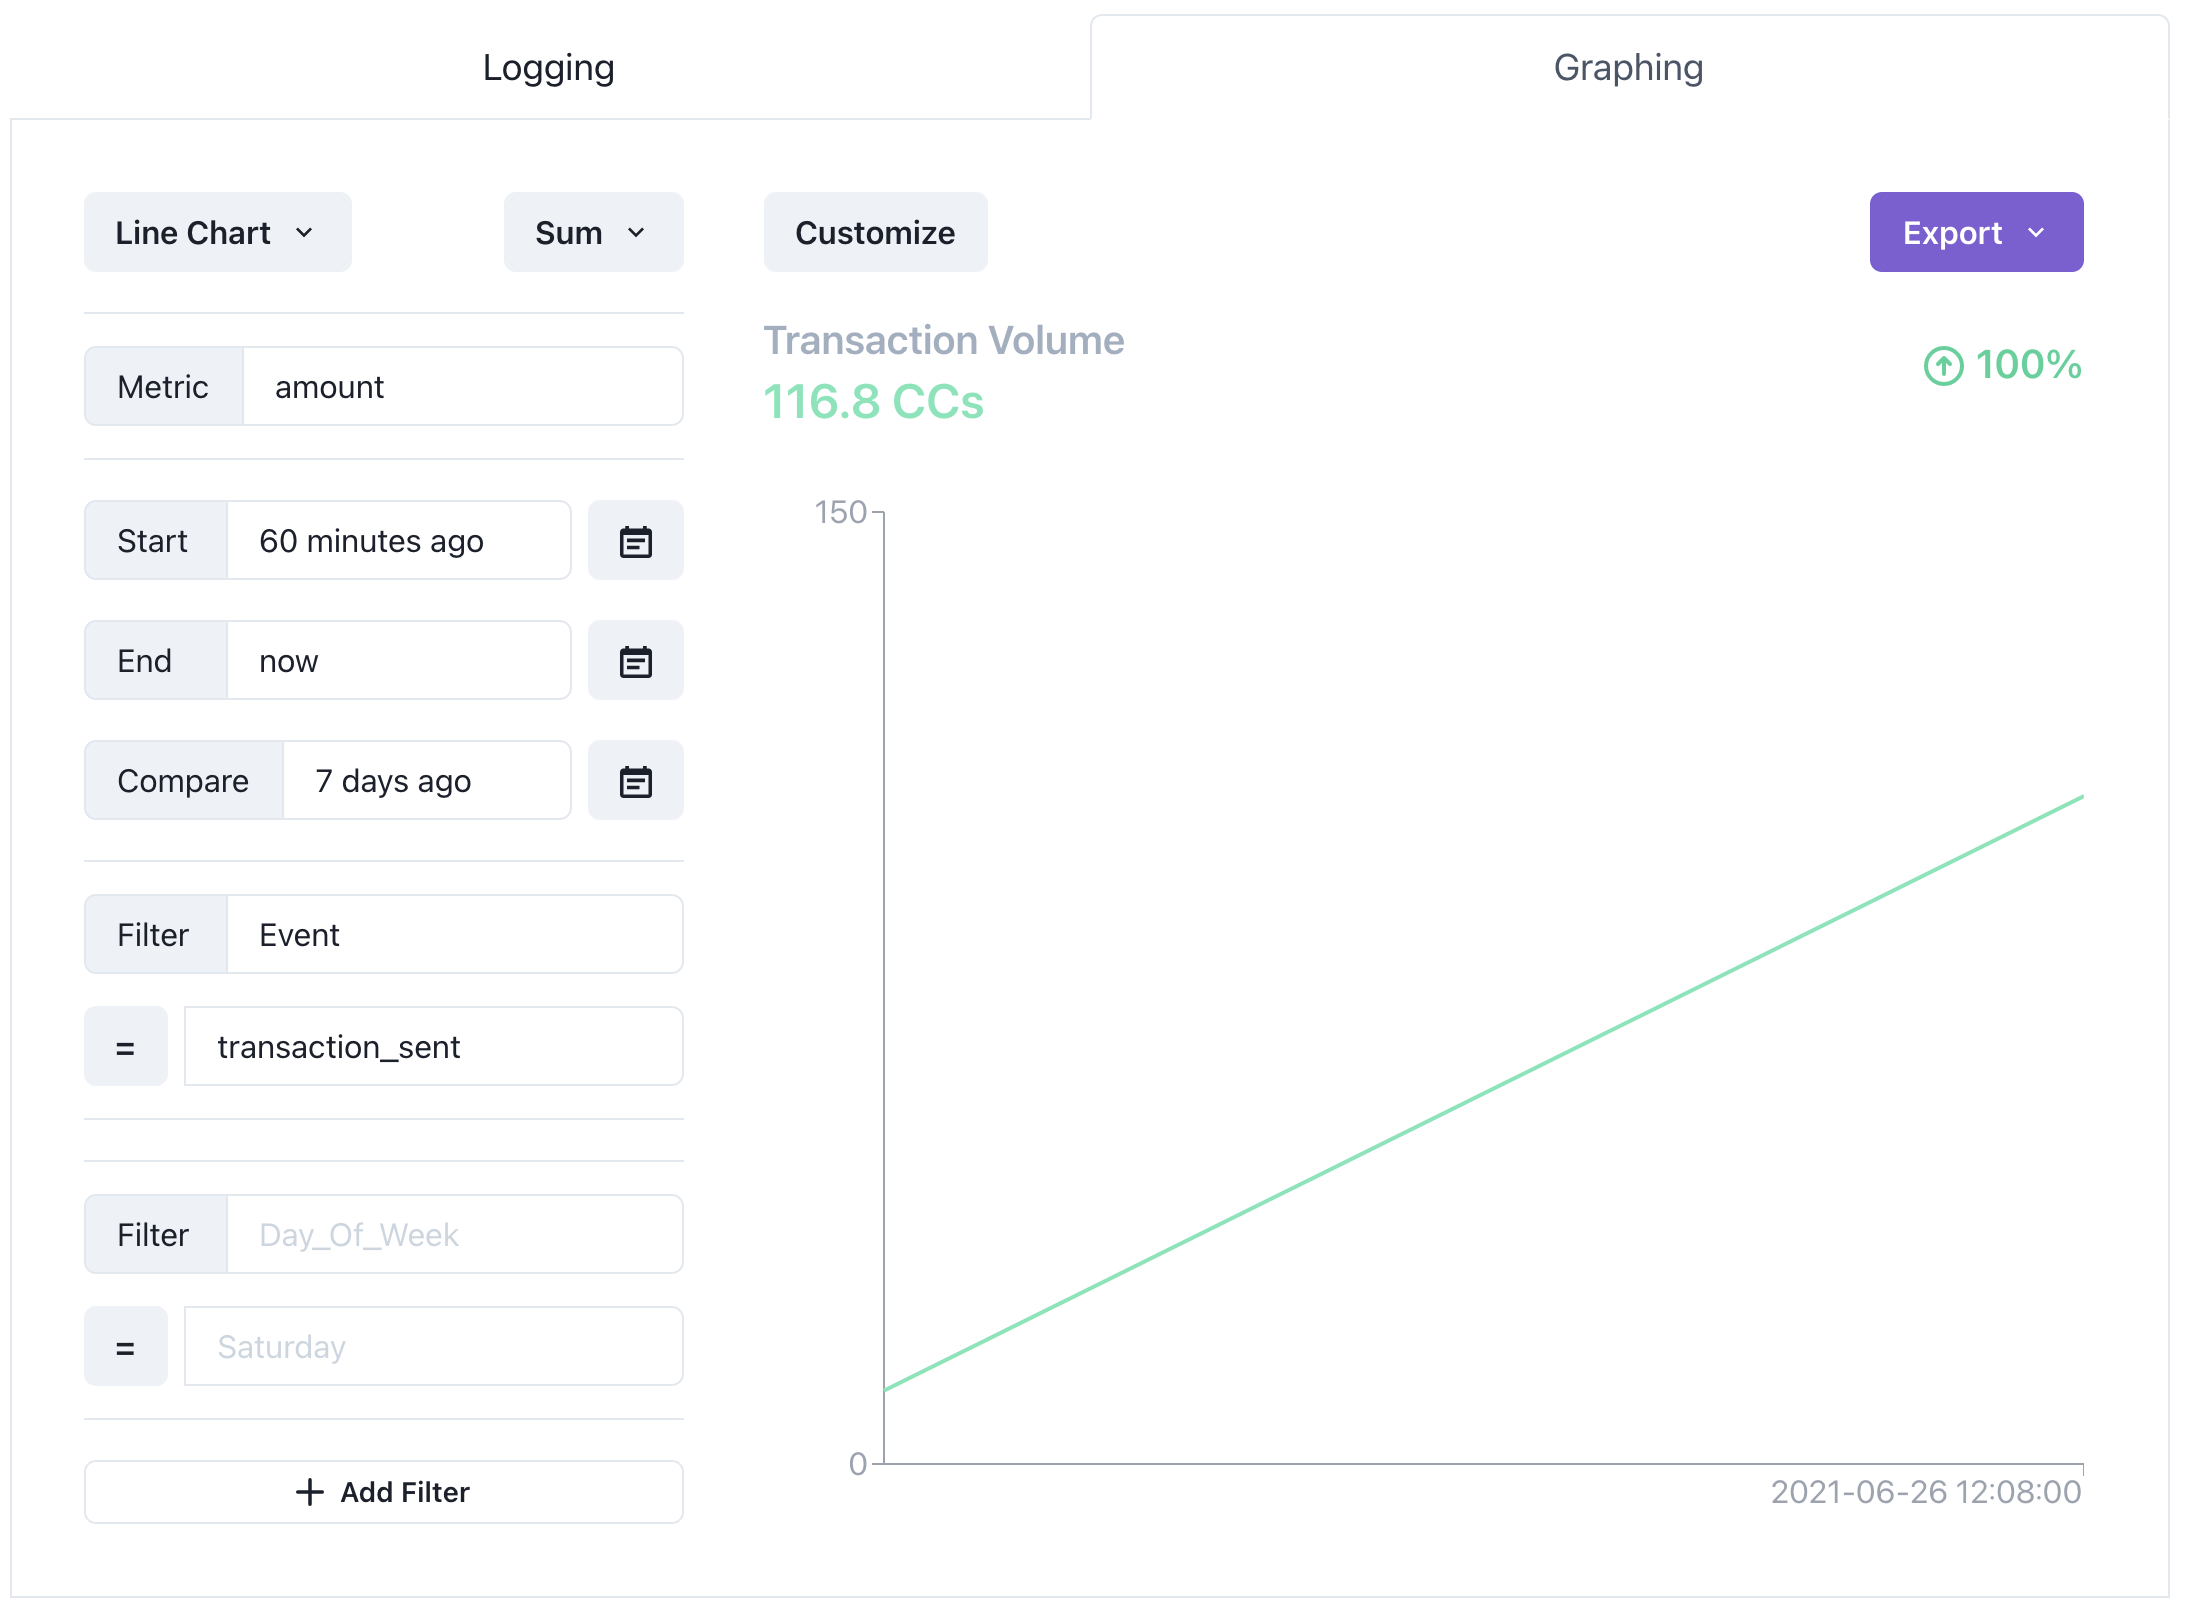
One detail that matters for a public page: make the graph match your brand. The Customize option lets you change the line color so the embed looks native to your site instead of a third-party widget.
Step 3: Embed it on your /open page#
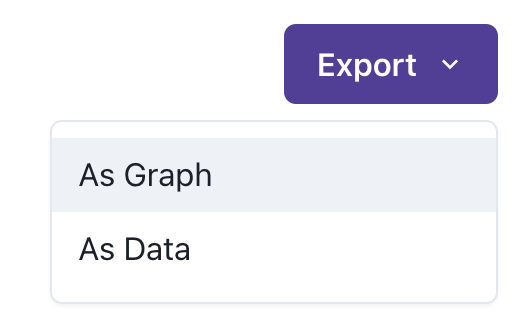
Select Export → Static iframe to get an iframe URL you can paste into any page.
Here's the result on the Centralized Coin demo page - a public FAQ that answers "Can I see how much volume the network is doing?" with a live graph instead of a screenshot that goes stale the day you take it.
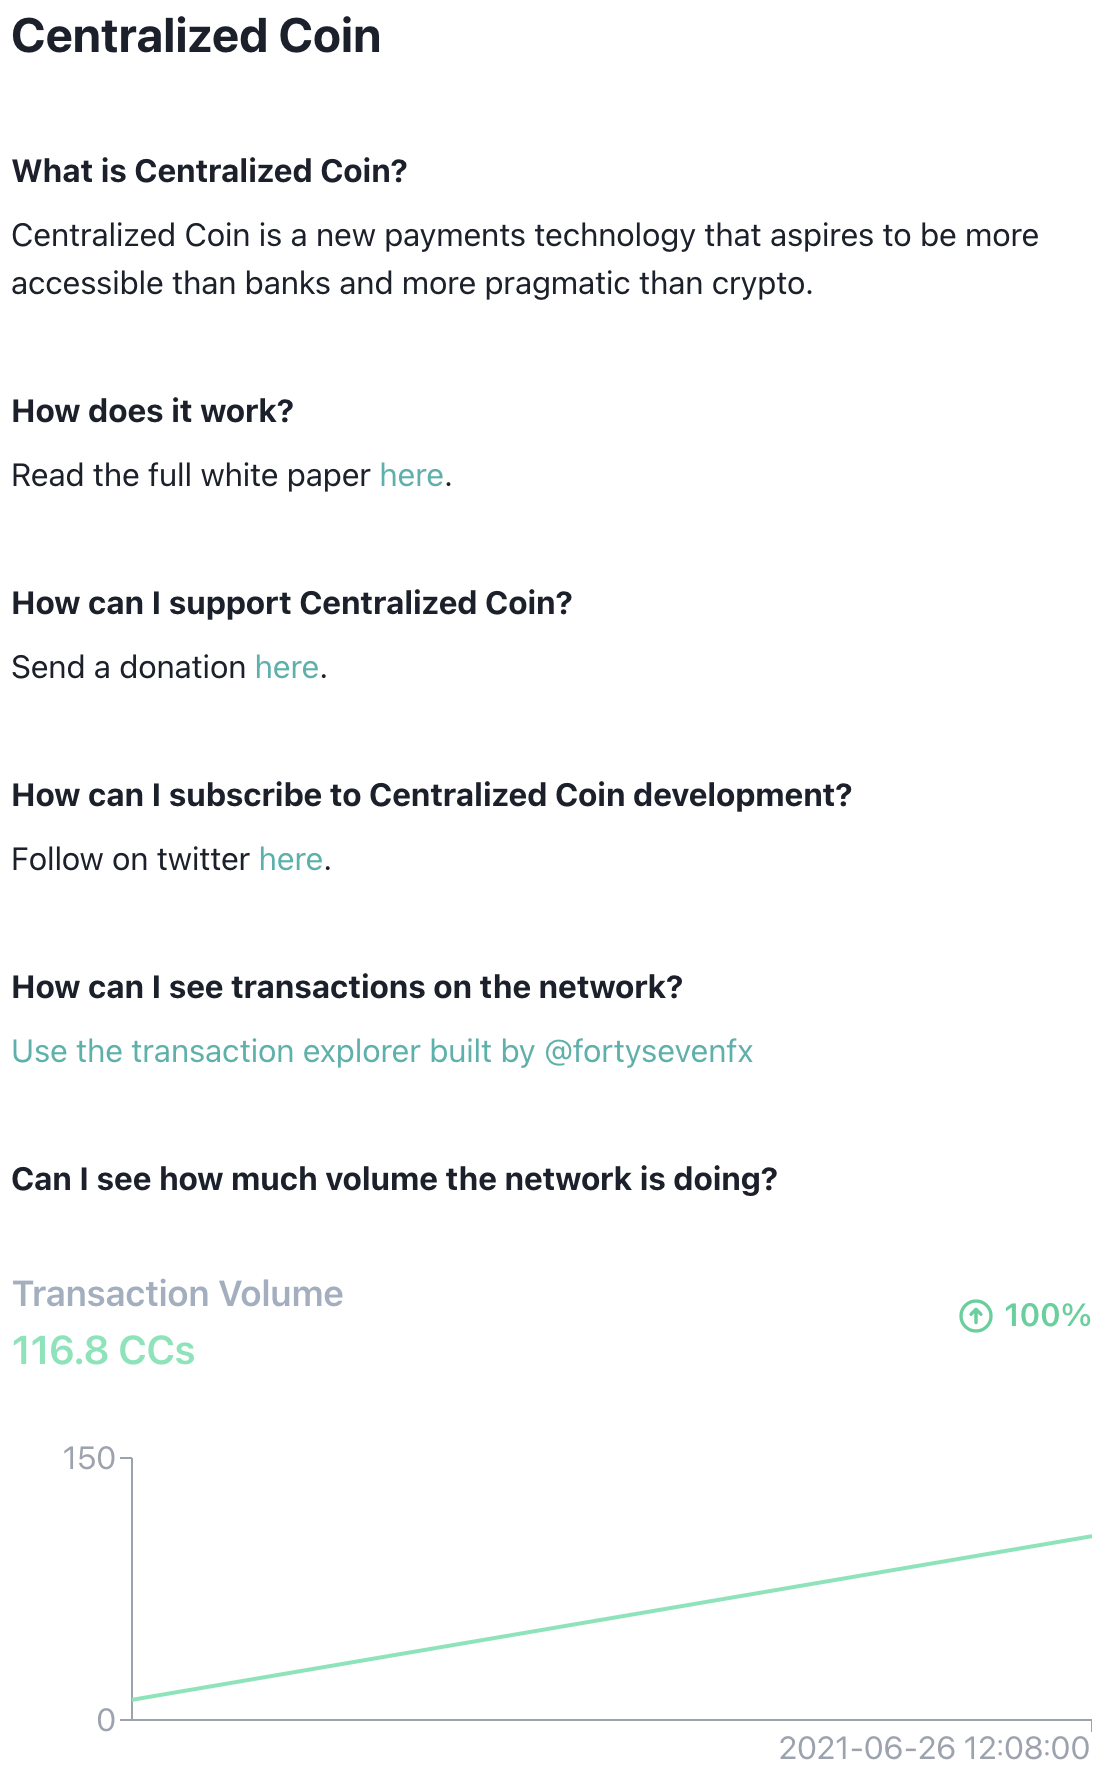
Embedded graphs are cached with a 15-minute TTL by default, so repeated views of the same configuration do not execute a new database query every time. Plan the page against GraphJSON’s documented service behavior rather than treating an example traffic number as a capacity guarantee.
Taking it further#
If you want to generate embeds programmatically - say, a different graph per page or per authorized filter - the Visualization API returns a URL you can use as an iframe source. Generate it on your server and derive sensitive filters from the authenticated viewer.
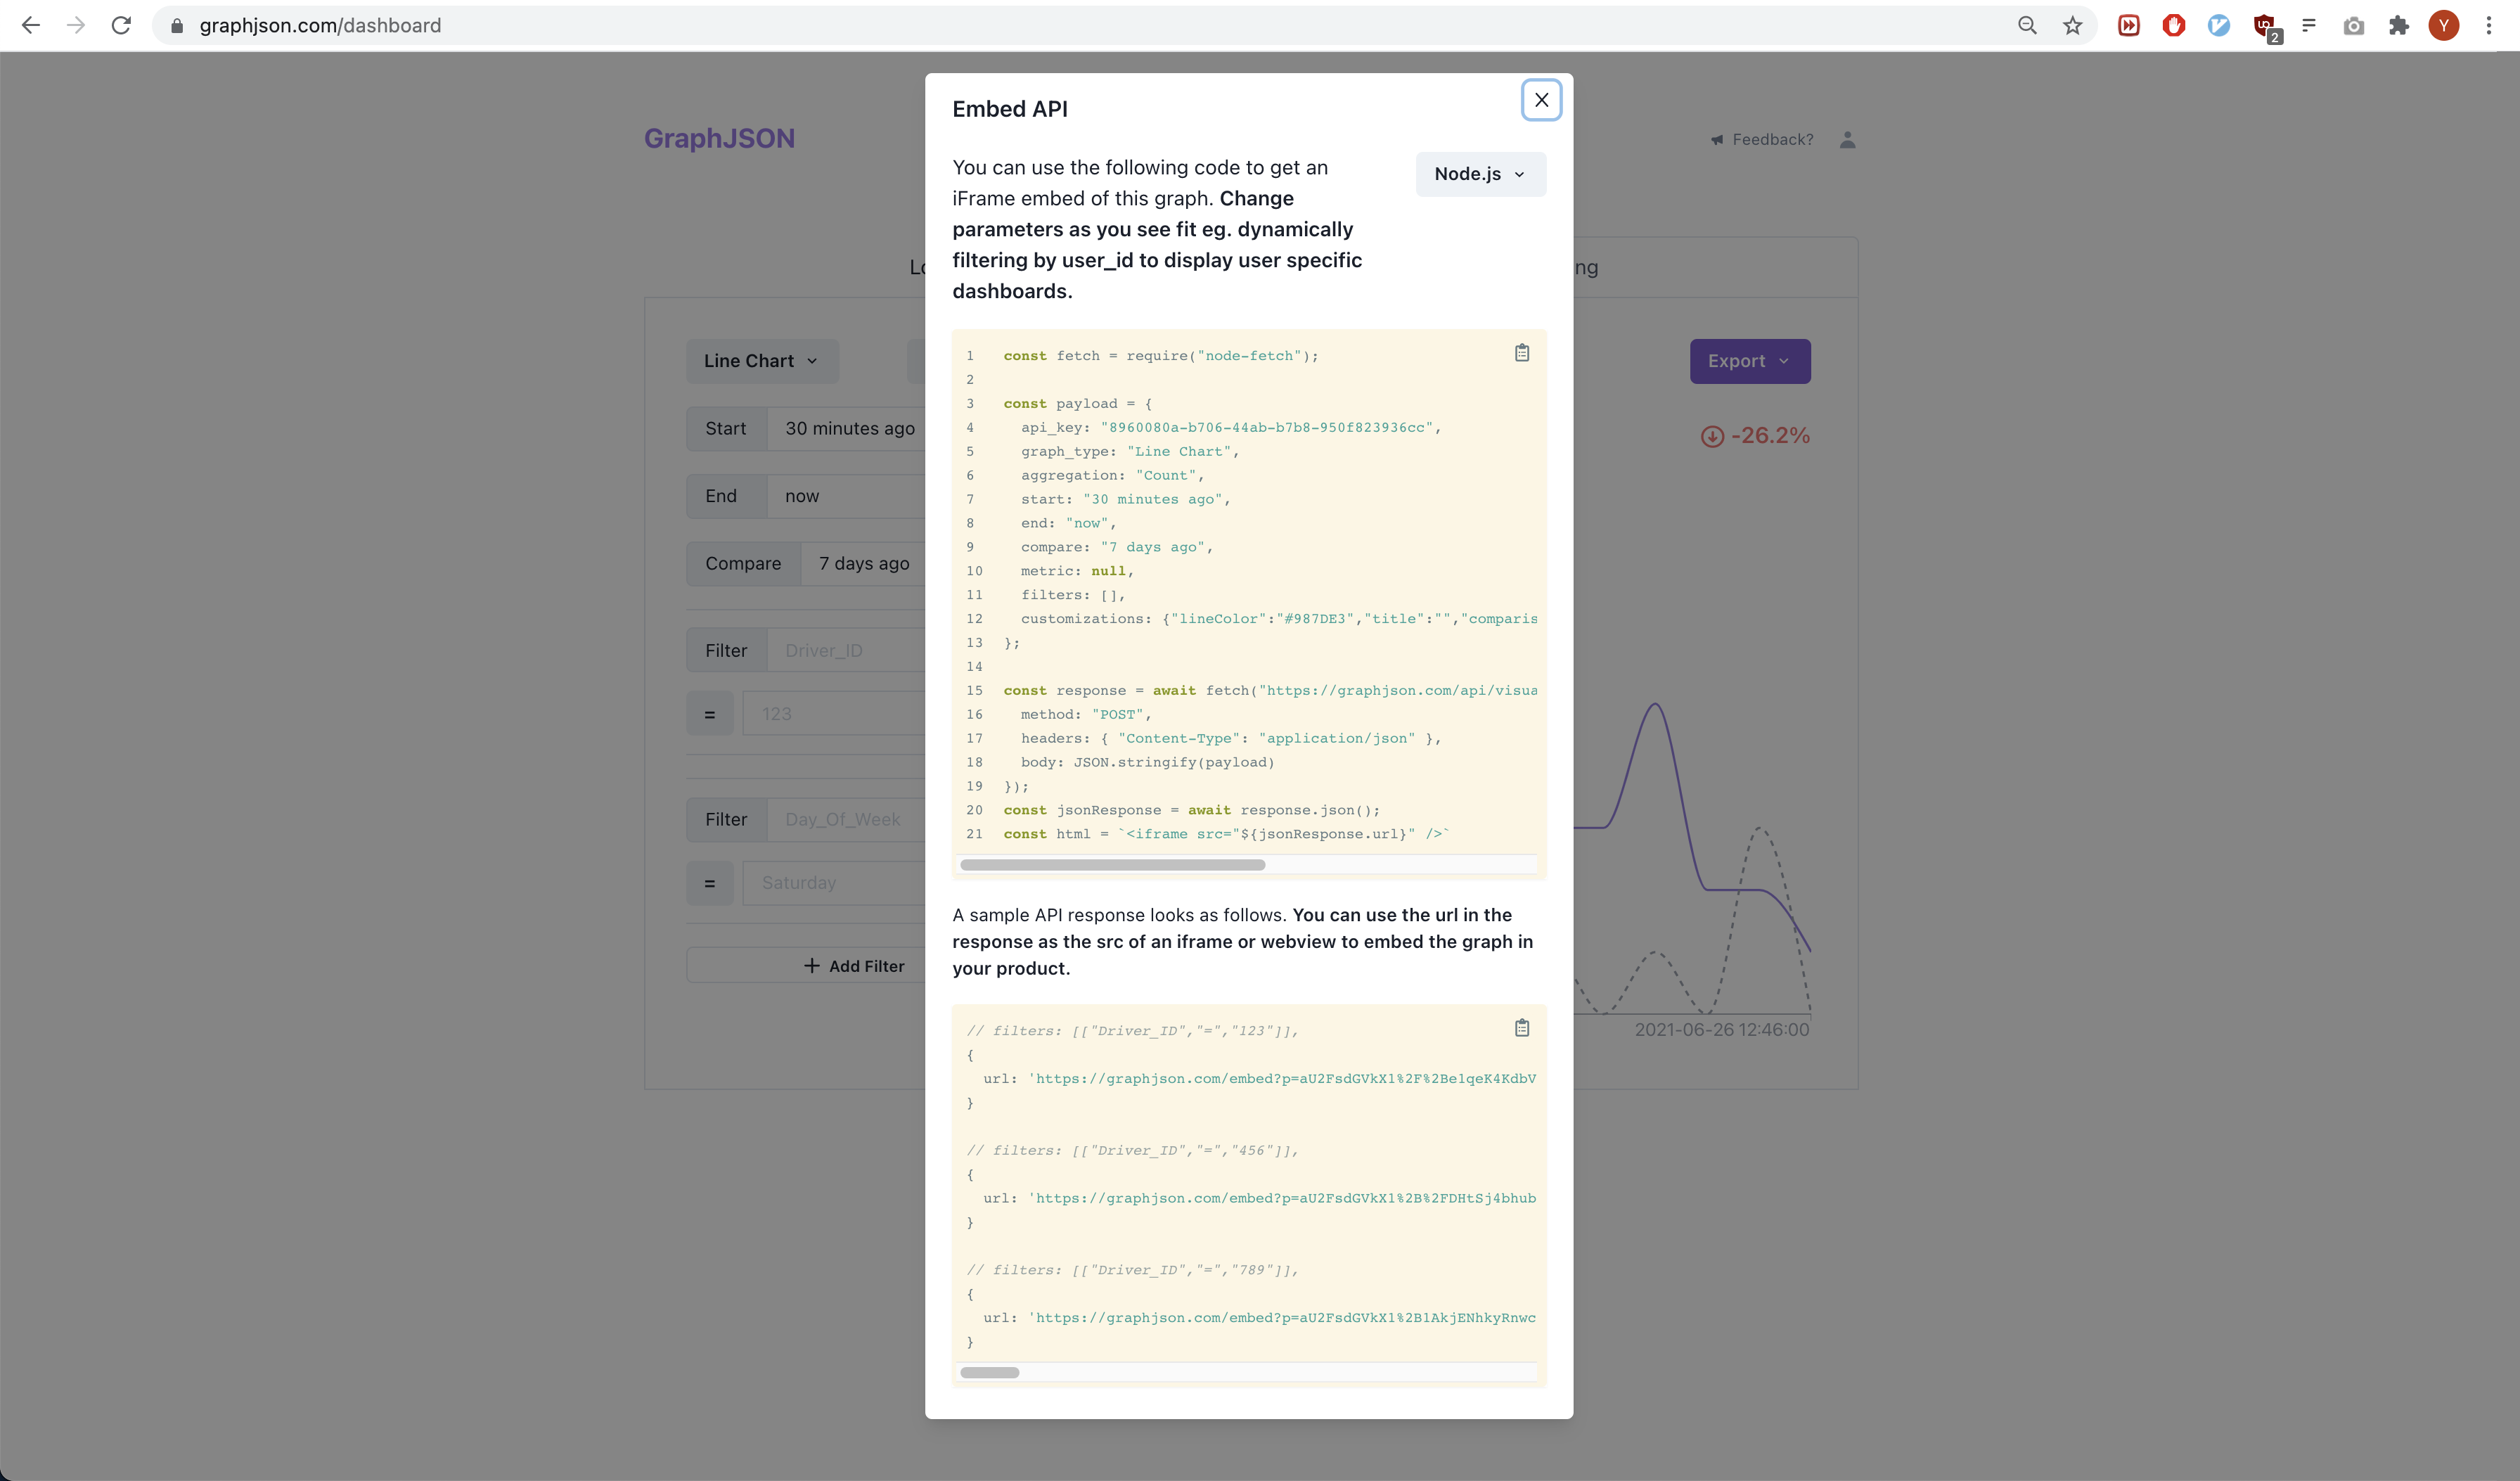
This is the same machinery you'd use to build per-user dashboards, which we cover in How to Build Personalized User Dashboards. For the full API details, take a look at the embedding guide in our docs.

Written by JR
Founder and builder of GraphJSON.


